Introduction to the Practice of Statistics
9th Edition
ISBN: 9781319013387
Author: David S. Moore, George P. McCabe, Bruce A. Craig
Publisher: W. H. Freeman
bartleby

Concept explainers

bartleby

Videos

Question
Book Icon
Chapter 5.2, Problem 27E

(a)

To determine

The population mean of 10 players.

(a)

Expert Solution
Check Mark

Answer to Problem 27E

Solution: The population mean is 120.5_.

Explanation of Solution

The population mean is calculated as given below.

PlayerTotal time(X)098163213732104525886151713381059168i=09Xi=1205

μ=i=1nXin=120510=120.5

Hence, the population mean is 120.5.

(b)

To determine

The simple random sample of size 3.

(b)

Expert Solution
Check Mark

Answer to Problem 27E

Solution: The selected simple random sample is the players numbered 1, 9, and 2.

Explanation of Solution

There are nine players numbered 0,19. The players in this study are selected using the random number table provided in the book. The three random numbers of one digit are chosen from the random number table, starting from the 101st row and the first column. The random number is selected between 0 and 9. The obtained samples are 1, 9, and 2. The players who have the same numbers with the selected random numbers will be included in the sample.

To determine

The sample mean.

Expert Solution
Check Mark

Answer to Problem 27E

Solution: The sample mean is 122.67_.

Explanation of Solution

The sample mean is calculated as

X¯=i=1n=3Xin=63+168+1373=3683=122.67

The sample mean of sample observations 1, 9, and 2 is 122.67.

(c)

To determine

The simple random samples of size 3 nine times.

(c)

Expert Solution
Check Mark

Answer to Problem 27E

Solution: The simple random samples obtained are

(9,5,0),(0,5,7),(2,8,7),(9,6,4),(1,2,5),(4,2,5),(8,2,8),(7,3,6),(4,7,1)_

Explanation of Solution

There are nine players numbered 0,1,..,9. The players in this study are chosen using the random number table provided in the book. The three random numbers of one digit are chosen from the random number table, starting from the 101st row and the first column of the table. The random number is selected between 0 and 9. The obtained samples are 9, 5, and 0. The players who have the same numbers with the selected random numbers are included in the sample. The remaining eight samples are drawn in the similar manner.

Hence, the table of all the 10 samples obtained is drawn as

Sample numberSample observations1(1,9,2)2(9,5,0)3(0,5,7)4(2,8,7)5(9,6,4)6(1,2,5)7(4,2,5)8(8,2,8)9(7,3,6)10(4,7,1)

To determine

The sample mean of the simple random samples drawn above.

Expert Solution
Check Mark

Answer to Problem 27E

Solution: The sample mean for each simple random sample is shown in the table below.

Explanation of Solution

The sample mean is calculated as

X¯=i=1n=3Xin=168+88+983=118

The sample means for 10 random samples are computed in a similar way. The table showing calculation for the computation of the sample mean is drawn below:

Sample numberSimple random samples Sample ObservationsSample mean11,9,263,168,13763+168+1373=122.6729,5,0168,88,98168+88+983=11830,5,798,88,13398+88+1333=106.3342,8,7137,105,133137+105+1333=12559,6,4168,151,52168+151+523=123.6761,2,563,137,8863+137+883=9674,2,552,137,5552+137+553=81.3388,2,8105,137,105105+137+1053=115.6797,3,6133,210,151133+210+1513=164.67104,7,152,133,6352+133+633=82.67

To determine

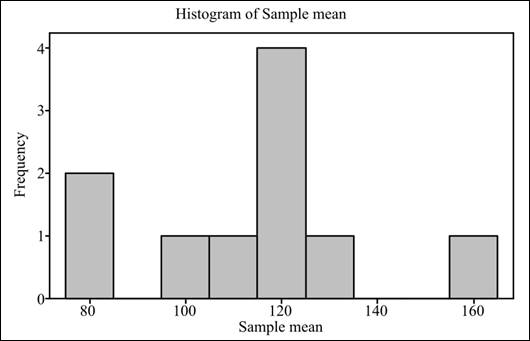
To graph: The histogram showing the 10 values of sample mean.

Expert Solution
Check Mark

Explanation of Solution

The histogram showing the values of 10 sample mean is drawn in Minitab. The steps are written below:

Step 1. Enter the data in Minitab classifying the sample mean of 10 samples.

Step 2. Click on Graph in toolbox and click on histogram.

Step 3. Next, choose simple histogram option appearing in the dialog box and click OK.

Step 4. Drag the sample mean appearing on the left side in Graph variables and click on OK..

Graph: The obtained histogram showing the frequency and sample mean is as follows:

Introduction to the Practice of Statistics, Chapter 5.2, Problem 27E

(d)

To determine

Whether the center of the histogram is close to population mean.

(d)

Expert Solution
Check Mark

Answer to Problem 27E

Solution: The center of the histogram is close to population mean.

Explanation of Solution

The histogram drawn in part (c) shows that the sample means of 10 samples are close to 120 and the population mean computed in part (a) is equal to 120.5. This shows that the population mean is approximately equal to the sample means obtained by drawing 10 simple random samples from the population.

Want to see more full solutions like this?

Subscribe now to access step-by-step solutions to millions of textbook problems written by subject matter experts!

Chapter 5 Solutions

Introduction to the Practice of Statistics

Ch. 5.1 - Prob. 11ECh. 5.1 - Prob. 12ECh. 5.1 - Prob. 13ECh. 5.1 - Prob. 14ECh. 5.1 - Prob. 15ECh. 5.1 - Prob. 16ECh. 5.2 - Prob. 17UYKCh. 5.2 - Prob. 18UYKCh. 5.2 - Prob. 19UYKCh. 5.2 - Prob. 20UYKCh. 5.2 - Prob. 21UYKCh. 5.2 - Prob. 22UYKCh. 5.2 - Prob. 23UYKCh. 5.2 - Prob. 24UYKCh. 5.2 - Prob. 25ECh. 5.2 - Prob. 26ECh. 5.2 - Prob. 27ECh. 5.2 - Prob. 28ECh. 5.2 - Prob. 29ECh. 5.2 - Prob. 30ECh. 5.2 - Prob. 31ECh. 5.2 - Prob. 32ECh. 5.2 - Prob. 33ECh. 5.2 - Prob. 34ECh. 5.2 - Prob. 35ECh. 5.2 - Prob. 36ECh. 5.2 - Prob. 37ECh. 5.2 - Prob. 38ECh. 5.2 - Prob. 39ECh. 5.2 - Prob. 40ECh. 5.2 - Prob. 41ECh. 5.2 - Prob. 42ECh. 5.3 - Prob. 43UYKCh. 5.3 - Prob. 44UYKCh. 5.3 - Prob. 45UYKCh. 5.3 - Prob. 46UYKCh. 5.3 - Prob. 47UYKCh. 5.3 - Prob. 48UYKCh. 5.3 - Prob. 49UYKCh. 5.3 - Prob. 50UYKCh. 5.3 - Prob. 51UYKCh. 5.3 - Prob. 52UYKCh. 5.3 - Prob. 53UYKCh. 5.3 - Prob. 54UYKCh. 5.3 - Prob. 55UYKCh. 5.3 - Prob. 56UYKCh. 5.3 - Prob. 57ECh. 5.3 - Prob. 58ECh. 5.3 - Prob. 59ECh. 5.3 - Prob. 60ECh. 5.3 - Prob. 61ECh. 5.3 - Prob. 62ECh. 5.3 - Prob. 63ECh. 5.3 - Prob. 64ECh. 5.3 - Prob. 65ECh. 5.3 - Prob. 66ECh. 5.3 - Prob. 67ECh. 5.3 - Prob. 68ECh. 5.3 - Prob. 69ECh. 5.3 - Prob. 70ECh. 5.3 - Prob. 71ECh. 5.3 - Prob. 72ECh. 5.3 - Prob. 73ECh. 5.3 - Prob. 74ECh. 5.3 - Prob. 75ECh. 5.3 - Prob. 76ECh. 5.3 - Prob. 77ECh. 5.3 - Prob. 78ECh. 5.3 - Prob. 79ECh. 5.3 - Prob. 80ECh. 5.3 - Prob. 81ECh. 5.3 - Prob. 82ECh. 5.3 - Prob. 83ECh. 5 - Prob. 84ECh. 5 - Prob. 85ECh. 5 - Prob. 86ECh. 5 - Prob. 87ECh. 5 - Prob. 88ECh. 5 - Prob. 89ECh. 5 - Prob. 90ECh. 5 - Prob. 91ECh. 5 - Prob. 92ECh. 5 - Prob. 93ECh. 5 - Prob. 94ECh. 5 - Prob. 95ECh. 5 - Prob. 96ECh. 5 - Prob. 97ECh. 5 - Prob. 98ECh. 5 - Prob. 99ECh. 5 - Prob. 100ECh. 5 - Prob. 101ECh. 5 - Prob. 102E
Knowledge Booster
Background pattern image
Statistics
Learn more about
Need a deep-dive on the concept behind this application? Look no further. Learn more about this topic, statistics and related others by exploring similar questions and additional content below.
Recommended textbooks for you
Text book image
MATLAB: An Introduction with Applications
Statistics
ISBN:9781119256830
Author:Amos Gilat
Publisher:John Wiley & Sons Inc
Text book image
Probability and Statistics for Engineering and th...
Statistics
ISBN:9781305251809
Author:Jay L. Devore
Publisher:Cengage Learning
Text book image
Statistics for The Behavioral Sciences (MindTap C...
Statistics
ISBN:9781305504912
Author:Frederick J Gravetter, Larry B. Wallnau
Publisher:Cengage Learning
Text book image
Elementary Statistics: Picturing the World (7th E...
Statistics
ISBN:9780134683416
Author:Ron Larson, Betsy Farber
Publisher:PEARSON
Text book image
The Basic Practice of Statistics
Statistics
ISBN:9781319042578
Author:David S. Moore, William I. Notz, Michael A. Fligner
Publisher:W. H. Freeman
Text book image
Introduction to the Practice of Statistics
Statistics
ISBN:9781319013387
Author:David S. Moore, George P. McCabe, Bruce A. Craig
Publisher:W. H. Freeman
Statistics 4.1 Point Estimators; Author: Dr. Jack L. Jackson II;https://www.youtube.com/watch?v=2MrI0J8XCEE;License: Standard YouTube License, CC-BY
Statistics 101: Point Estimators; Author: Brandon Foltz;https://www.youtube.com/watch?v=4v41z3HwLaM;License: Standard YouTube License, CC-BY
Central limit theorem; Author: 365 Data Science;https://www.youtube.com/watch?v=b5xQmk9veZ4;License: Standard YouTube License, CC-BY
Point Estimate Definition & Example; Author: Prof. Essa;https://www.youtube.com/watch?v=OTVwtvQmSn0;License: Standard Youtube License
Point Estimation; Author: Vamsidhar Ambatipudi;https://www.youtube.com/watch?v=flqhlM2bZWc;License: Standard Youtube License