
Videos
(a)
To find: The mean and standard deviation of the random variable X.
(a)
Answer to Problem 78E
Solution: The mean and standard deviation of the binomial random variable X is 996 and 13.012 respectively.
Explanation of Solution
Calculation: In binomial distribution, the mean can be calculated by this formula,
In binomial distribution, standard deviation can be calculated by this formula,
Where, n is the number of trials and p is the probability of success in a trial. For
The standard deviation is calculated as:
Hence, the average value and standard deviation are 996 and 13.012 respectively.
(b)
To find: The probability.
(b)
Answer to Problem 78E
Solution: The probability is
Explanation of Solution
Calculation: The binomial random variable approximately follows the
Therefore, the random variable X can be approximated to normal distribution because the given condition is fulfilled.
The parameters of the normal distribution are calculated as follows:
And:
The probability that the value taken by X is greater than or equal to 800 is the area right to the point 800 under the normal curve. To obtain the area lying to the left of a point under the normal curve, first, convert the value of the variable into Z-score and then obtain the area lying to the right by subtracting the area left to the Z-score from 1. The Z-score for the value
The area left to the particular Z-score can be obtained using Excel by using the command
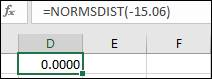
The area left to the Z-score,
So, the required probability can be calculated as:
Hence, the probability is 1.
(c)
To find: The probability.
(c)
Answer to Problem 78E
Solution:
Explanation of Solution
Calculation: For the probability that more than 1000 candidates will accept the admission, Excel has to be used. The following procedure is followed in Excel:
Step 1: Open the Excel spreadsheet.
Step 2: Type the command
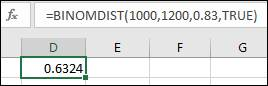
Therefore, the required probability is calculated as:
Hence, the probability is 0.3676.
(d)
To find: The probability.
(d)
Answer to Problem 78E
Solution:
Explanation of Solution
Calculation: The probability that more than 1000 candidates will accept the admission, Excel has to be used. The following procedure is followed in Excel:
Step 1: Open the Excel spreadsheet.
Step 2: Type the command
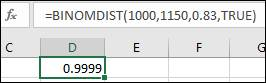
Therefore, the required probability is calculated as:
Hence, the probability is 0.0001.
Want to see more full solutions like this?
Chapter 5 Solutions
Introduction to the Practice of Statistics


 MATLAB: An Introduction with ApplicationsStatisticsISBN:9781119256830Author:Amos GilatPublisher:John Wiley & Sons Inc
 Probability and Statistics for Engineering and th...StatisticsISBN:9781305251809Author:Jay L. DevorePublisher:Cengage Learning
 Statistics for The Behavioral Sciences (MindTap C...StatisticsISBN:9781305504912Author:Frederick J Gravetter, Larry B. WallnauPublisher:Cengage Learning
 Elementary Statistics: Picturing the World (7th E...StatisticsISBN:9780134683416Author:Ron Larson, Betsy FarberPublisher:PEARSON
 The Basic Practice of StatisticsStatisticsISBN:9781319042578Author:David S. Moore, William I. Notz, Michael A. FlignerPublisher:W. H. Freeman
 Introduction to the Practice of StatisticsStatisticsISBN:9781319013387Author:David S. Moore, George P. McCabe, Bruce A. CraigPublisher:W. H. Freeman