
Concept explainers
Videos
a.
Find the equation of the least-squares line, if y is expressed in kilograms instead of pounds.
a.
Answer to Problem 28E
The equation of the least-squares line, if y is expressed in kilograms instead of pounds is
Explanation of Solution
Calculation:
The least-squares regression equation relating the shear strength (pounds or lb), y of steel to weld diameter, x is given as
Data transformation:
Software procedure:
Step-by-step procedure to transform the data using the MINITAB software:
- Choose Calc > Calculator.
- Enter the column of y1 under Store result in variable.
- Enter the 0.4536*‘y’ in Expression.
- Click OK in all dialogue boxes.
The transformed data, where each
The least-squares equation can be obtained using software.
Least-squares equation:
Software procedure:
Step-by-step procedure to obtain the least-squares equation using the MINITAB software:
- Choose Stat > Regression > Regression > Fit Regression Model.
- Enter the column of y1 under Responses.
- Enter the column of x under Continuous predictors.
- Choose Results and select Coefficients, Regression Equation.
- Click OK in all dialogue boxes.
Output obtained using MINITAB is given below:
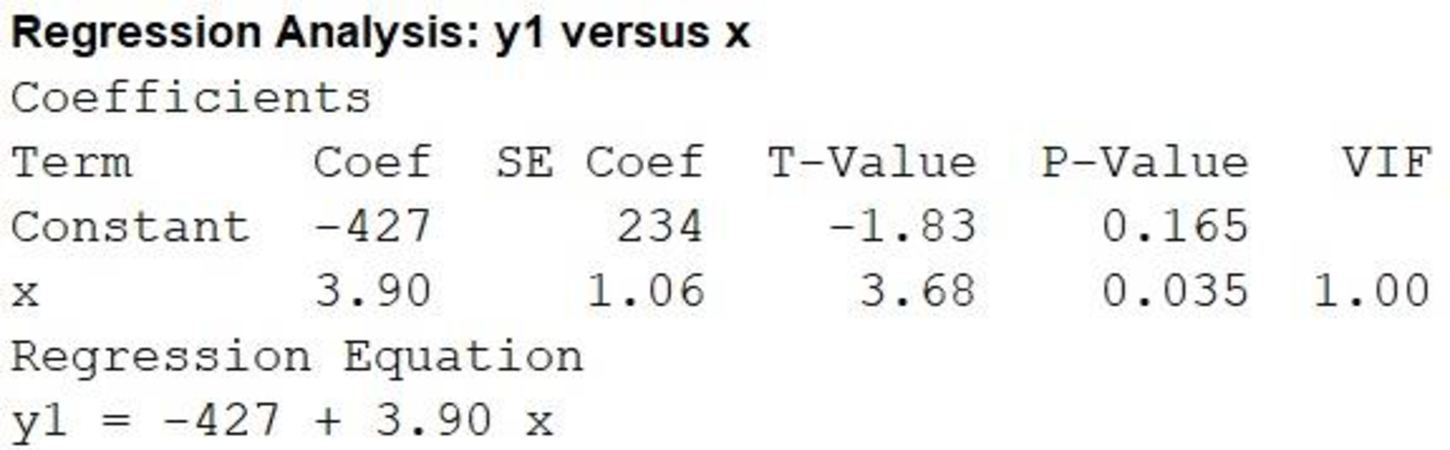
Thus, the equation of the least-squares line, if y is expressed in kilograms instead of pounds is
b.
Find the new slope, intercept, and equation of the least-squares line, if a constant, c is multiplied with every observation on y.
b.
Answer to Problem 28E
The new slope is –936.22 c.
The new intercept is 8.577 c.
The new equation of the least-squares line is
Explanation of Solution
Calculation:
Changing the unit of y from pounds to kilograms causes a change in the scale of y. Now, if the scale of the response variable in a regression, y, is changed by multiplying with a constant c, each least-squares coefficient is also multiplied by c.
Thus, each coefficient in the regression equation, that is, the intercept –936.22 and the slope corresponding to x, 8.577, will be multiplied by c, in order to get the regression equation in this situation. The regression equation is
Thus, the new slope is –936.22 c; the new intercept is 8.577 c; the new equation of the least-squares line is
These can be verified by using the formulae for a and b. The general formulae for a and b, for a simple least-squares regression equation,
Now,
Therefore,
Substitute the values of new a and newb in the general form of the regression equation.
In this problem, a = –936.22 and b = 8.577. As a result, the new slope is –936.22 c; the new intercept is 8.577 c.
Substituting these values in the equation for
Want to see more full solutions like this?
Chapter 5 Solutions
Introduction to Statistics and Data Analysis


- The article “Characterization of Highway Runoff in Austin, Texas, Area” (J. of Envir. Engr., 1998: 131–137) gave a scatterplot, along with the least squares line, of x = rainfall volume (m3) and y = runoff volume (m3) for a particular location. The accompanying values were read from the plot. x <‐ c(5, 12, 14, 17, 23, 30, 40, 47, 55, 67, 72, 81, 96, 112, 127) y <‐ c(4, 10, 13, 15, 15, 25, 27, 46, 38, 46, 53, 70, 82, 99, 100) Test at level 0.05 whether there is a useful linear relationship between rainfall and runoff,and then calculate a 95% confidence interval for the true average change in runoff volumeassociated with one unit (one m3) increase in rainfall volume.arrow_forwardIn Austria ,The amount of money spent on the restoration of a sanctuary and the distinct kangaroo populations present appeared to have negative correlations For investigation of this onserved assocaition ,what can a resecher do to begin his research 1Conduct an experiment 2Calculate the squares of coreealtion coefficient 3Calculate the least squares regression line 4 calculate the corelation coefficient Explain answer in 1 or 2 linesarrow_forwardThe datafile Gestation06 lists the average gestation period (in days) and longevity (in years) for a sample of animals, as reported in The World Almanac and Book of Facts 2006.Use the least squares line to calculate the fitted value and residual for a polar bear. [Hint: First, find the polar bear's longevity and gestation period in the datafile.]arrow_forward
- The Research Unit for Cecilion Supermart conducted an experiment to estimate the strength of the carrier bag from the starch-based biofilms made from two different jicamas (sengkuang) of type A and type B. However, the researcher claims that jicama type A produces more strength compared to type B. To support this claim, 10kg weight item was put into 100 carrier bags made from jicama type A and 200 carrier bags made from jicama type B were randomly selected. As a result, 8 bags from jicama type A burst while 12 bags from jicama type B burst. Calculate a 95% confidence interval for the difference in true proportion of the carrier bags which burst between jicama type A and type B. Give comment on the parameter estimate.arrow_forwardEnter the equation of the least‑squares regression line, with the numerical values rounded to three decimal places and ?� as the explanatory variable. (If you are using CrunchIt, adjust the default precision under Preferences as necessary.arrow_forwardWrite down the formula of least square regression line?arrow_forward
- Consider the points (1, 1), (2, 3), (−3, 1). Find the least squares regression line.arrow_forwardA Manager wants to know whether the level of Sale (Y) in Peshawar regions in 6 months after Advertisement could be predicted with strategy (X1) and (X2). (a)The least squares estimation equation involving both independent variables is given by Y = -0.628 + 23.639(X1) – 7.147(X2) Using this equation, determine the predicted level of Sale (Y) for Peshawar region with scores of 2.80 on Strategy X1 and 7.0 on Strategy X2. How does the predicted value obtained compare with the actual value of 25 observed for this region? (b)Using the analysis of variance tables below, carry out the overall F test for each of three models: i) model with X1 alone; ii) model with X2 alone; and iii) model with both X1 and X2 (c)Based on your results in part (b), how would you rate the importance of the two variables in predicting Y? (d)What are the R 2 values for the three regressions referred to in part (b)? (e)Based on the above, in your opinion, which is the best model involving either one or both of the…arrow_forwardA manufacturer of salad dressings uses machines to dispense liquid ingredients into bottles that move along a filling line. The machine that dispenses salad dressings is working properly when 8 ounces are dispensed. Suppose that the average amount dispensed in a particular sample of 35 bottles is 7.91 ounces with a variance of 0.03 ounces squared. Is there evidence that the machine should be stopped and production wait for repairs? The lost production from a shutdown is potentially so great that management feels that the level of significance in the analysis should be 99%. (solve without excel)arrow_forward
 MATLAB: An Introduction with ApplicationsStatisticsISBN:9781119256830Author:Amos GilatPublisher:John Wiley & Sons Inc
 Probability and Statistics for Engineering and th...StatisticsISBN:9781305251809Author:Jay L. DevorePublisher:Cengage Learning
 Statistics for The Behavioral Sciences (MindTap C...StatisticsISBN:9781305504912Author:Frederick J Gravetter, Larry B. WallnauPublisher:Cengage Learning
 Elementary Statistics: Picturing the World (7th E...StatisticsISBN:9780134683416Author:Ron Larson, Betsy FarberPublisher:PEARSON
 The Basic Practice of StatisticsStatisticsISBN:9781319042578Author:David S. Moore, William I. Notz, Michael A. FlignerPublisher:W. H. Freeman
 Introduction to the Practice of StatisticsStatisticsISBN:9781319013387Author:David S. Moore, George P. McCabe, Bruce A. CraigPublisher:W. H. Freeman