
Fundamentals of Biostatistics
8th Edition
ISBN: 9781305268920
Author: Bernard Rosner
Publisher: Cengage Learning
expand_more
expand_more
format_list_bulleted
Videos
Textbook Question
Chapter 6, Problem 24P
A study of psychological and physiological health in a cohort of dialysis patients with end-stage renal disease was conducted [7]. Psychological and physiological parameters were initially determined at baseline in 102 patients; these parameters were determined again in 69 of the 102 patients at an 18-month follow-up visit. The data in Table 6.12 were reported.
Table 6.12 Psychological and physiological parameters in patients with end-stage renal disease
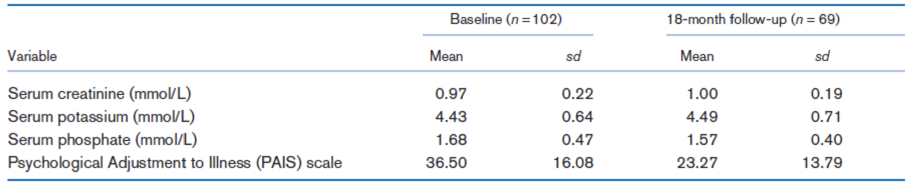
Do you have any opinion on the physiological and psychological changes in this group of patients? Explain.(Note: A lower score on the PAIS scale indicates worse adjustment to illness.)
Expert Solution & Answer

Trending nowThis is a popular solution!

Students have asked these similar questions
The director of an obesity clinic in a large northwestern city believes that drinking soft drinks contribute to obesity in children. To determine whether a relationship exists between these two variables, she conducts the following pilot study. Eight- 12-year-old male volunteers are randomly selected from children attending a local junior high school. Parents of the children are asked to monitor the number of soft drinks consumed by their child over a one week period. The children are weighed at the end of the week and their weights converted into body mass index (BMI) values. The BMI is a common index used to measure obesity and takes into account both height and weight. An individual is considered obese if they have a BMI value 30. The following data or collected:
child. # of soft drinks consumed BMI
1 3 20
2 1 18
3…
5.1 Determine the equation of the relationship between the predictor variable (x) and the response variable (y).
5.2 What does the simple linear regression equation obtained in question 5.1 indicates on every 1 km/hr increase in speed?
5.3 Using the simple linear regression equation obtained in question 5.1, estimate the total fuel expenditure of a randomly selected driver of one of the newly launched Volvo trucks who drove at an average speed of 100 km/hr during a 900 km haulage.
5.4 Determine the Pearson Correlation Coefficient.
Mercury Levels in Fish
Figure 4.25 shows a scatterplot of the acidity (pH) for a sample of n = 53 Florida lakes vs the average mercury level (ppm) found in fish taken from each lake. The full dataset is introduced in Data 2.4 and is available in FloridaLakes. There appears to be a negative trend in the scatterplot, and we wish to test whether there is significant evidence of a negative association between pH and mercury levels.
Figure 4.25 Water pH vs mercury levels of fish in Florida lakes
(a)
What are the null and alternative hypotheses?
b)
For these data, a statistical software package produces the following output:
r=−0.575p-value=0.000017
Use the p-value to give the conclusion of the test. Include an assessment of the strength of the evidence and state your result in terms of rejecting or failing to reject H0 and in terms of pH and mercury.
(c)
Is this convincing evidence that low pH causes the average mercury level in fish to increase? Why or why not?
Chapter 6 Solutions
Fundamentals of Biostatistics
Ch. 6.5 - What is the difference between a standard...Ch. 6.5 - What does a 95% CI mean?Ch. 6 - Suppose we are asked to construct a list of...Ch. 6 - Suppose we are asked to construct a list of...Ch. 6 - Suppose we are asked to construct a list of...Ch. 6 - Suppose we are asked to construct a list of...Ch. 6 - The data in Table 6.10 concern the mean triceps...Ch. 6 - The data in Table 6.10 concern the mean triceps...Ch. 6 - The data in Table 6.10 concern the mean triceps...Ch. 6 - The data in Table 6.10 concern the mean triceps...
Ch. 6 - The data in Table 6.10 concern the mean triceps...Ch. 6 - The data in Table 6.10 concern the mean triceps...Ch. 6 - Refer to the data in Table 2.13. Regard this...Ch. 6 - Refer to the data in Table 2.13. Regard this...Ch. 6 - Refer to the data in Table 2.13. Regard this...Ch. 6 - Refer to the data in Table 2.13. Regard this...Ch. 6 - Refer to the data in Table 2.13. Regard this...Ch. 6 - Refer to the data in Table 2.13. Regard this...Ch. 6 - Refer to the data in Table 2.13. Regard this...Ch. 6 - A nine-laboratory cooperative study was performed...Ch. 6 - A nine-laboratory cooperative study was performed...Ch. 6 - A nine-laboratory cooperative study was performed...Ch. 6 - A nine-laboratory cooperative study was performed...Ch. 6 - A nine-laboratory cooperative study was performed...Ch. 6 - A study of psychological and physiological health...Ch. 6 - A study of psychological and physiological health...Ch. 6 - A study is conducted to test the hypothesis that...Ch. 6 - A study is conducted to test the hypothesis that...Ch. 6 - Suppose a clinical trial is conducted to test the...Ch. 6 - Suppose a clinical trial is conducted to test the...Ch. 6 - Suppose a clinical trial is conducted to test the...Ch. 6 - Suppose we want to estimate the concentration...Ch. 6 - Suppose we want to estimate the concentration...Ch. 6 - Suppose we want to estimate the concentration...Ch. 6 - Much discussion has taken place concerning...Ch. 6 - Much discussion has taken place concerning...Ch. 6 - Much discussion has taken place concerning...Ch. 6 - A new assay is developed to obtain the...Ch. 6 - A new assay is developed to obtain the...Ch. 6 - A new assay is developed to obtain the...Ch. 6 - A new assay is developed to obtain the...Ch. 6 - Suppose 100 hypertensive people are given an...Ch. 6 - Suppose 100 hypertensive people are given an...Ch. 6 - Suppose 100 hypertensive people are given an...Ch. 6 - Suppose we decide a better measure of the...Ch. 6 - Suppose we decide a better measure of the...Ch. 6 - Suppose we decide a better measure of the...Ch. 6 - Suppose we decide a better measure of the...Ch. 6 - Draw six random samples of size 5 from the data in...Ch. 6 - Draw six random samples of size 5 from the data in...Ch. 6 - Draw six random samples of size 5 from the data in...Ch. 6 - Draw six random samples of size 5 from the data in...Ch. 6 - Draw six random samples of size 5 from the data in...Ch. 6 - Figure 6.4b (p. 172) plotted the sampling...Ch. 6 - Figure 6.4b (p. 172) plotted the sampling...Ch. 6 - Figure 6.4b (p. 172) plotted the sampling...Ch. 6 - Figure 6.4b (p. 172) plotted the sampling...Ch. 6 - The etiology of high blood pressure remains a...Ch. 6 - The etiology of high blood pressure remains a...Ch. 6 - The etiology of high blood pressure remains a...Ch. 6 - Data Set SEXRAT.DAT, at www.cengagebrain.com,...Ch. 6 - A cohort of hemophiliacs is followed to elicit...Ch. 6 - A cohort of hemophiliacs is followed to elicit...Ch. 6 - A cohort of hemophiliacs is followed to elicit...Ch. 6 - We have previously described Data Set LEAD.DAT (at...Ch. 6 - We have previously described Data Set LEAD.DAT (at...Ch. 6 - We have previously described Data Set LEAD.DAT (at...Ch. 6 - Data Set NIFED.DAT (at www.cengagebrain.com) was...Ch. 6 - Data Set NIFED.DAT (at www.cengagebrain.com) was...Ch. 6 - Data Set NIFED.DAT (at www.cengagebrain.com) was...Ch. 6 - Suppose that there are 6 deaths due to bladder...Ch. 6 - Suppose that there are 4 deaths due to stomach...Ch. 6 - The value of mammography as a screening test for...Ch. 6 - The value of mammography as a screening test for...Ch. 6 - The value of mammography as a screening test for...Ch. 6 - The value of mammography as a screening test for...Ch. 6 - On the computer, draw 1000 bootstrap samples of...Ch. 6 - On the computer, draw 1000 bootstrap samples of...Ch. 6 - A study was performed to investigate the...Ch. 6 - A study was performed to investigate the...Ch. 6 - Refer to Data Set BONEDEN.DAT at...Ch. 6 - Refer to Data Set BONEDEN.DAT at...Ch. 6 - Prob. 88PCh. 6 - Prob. 89PCh. 6 - Prob. 90PCh. 6 - Prob. 91PCh. 6 - Prob. 92PCh. 6 - Prob. 93PCh. 6 - Prob. 94PCh. 6 - Prob. 95PCh. 6 - Prob. 96PCh. 6 - A patient who is taking antihypertensive...Ch. 6 - A patient who is taking antihypertensive...Ch. 6 - A patient who is taking antihypertensive...Ch. 6 - A patient who is taking antihypertensive...Ch. 6 - A patient who is taking antihypertensive...Ch. 6 - Injuries are common in football and may be related...Ch. 6 - Injuries are common in football and may be related...Ch. 6 - A hypertensive patient has been on...Ch. 6 - A hypertensive patient has been on...Ch. 6 - A hypertensive patient has been on...Ch. 6 - A hypertensive patient has been on...Ch. 6 - A radiologist investigates whether a new (less...Ch. 6 - A radiologist investigates whether a new (less...Ch. 6 - The estimation of allele probabilities is...Ch. 6 - The estimation of allele probabilities is...Ch. 6 - The estimation of allele probabilities is...Ch. 6 - As an experiment, 10,000 people are completely...Ch. 6 - As an experiment, 10,000 people are completely...Ch. 6 - Which of the following sample results yields a 95%...Ch. 6 - Suppose we observe 30 cases of colon cancer over...
Knowledge Booster


Learn more about
Need a deep-dive on the concept behind this application? Look no further. Learn more about this topic, statistics and related others by exploring similar questions and additional content below.Similar questions
- 1. What is the most important predictor in terms of contribution to the dependent variable? 2. Which of the following is not a significant predictor at 5%? 3. Which of the following is the best predictor?arrow_forwardon the basis of the value of linear correlation coefficient, would you conclude, at the /r/>0.9 level, that the data can be reasonably modeled linear equation?arrow_forwardData was collected on 54 observations on a response of interest, y, and four potential predictor variables x1, x2, x3, and x4. The output from regression analyses of the data is attached to the end of the page. d) Is the variable from your best simple linear regression model (from part a) included in the model with the lowest overall MSE (part b)? Briefly explain why it could happen that the best single variable is not in the best overall model. e) Following the best subsets regression results, the sums of squares for regression and error (also called residual) are displayed for several models. Using the regression sums of squares information for the full model containing all four x variables, calculate i) the R2 value for the full model, ii) the F statistic for the test of the H0: b1 = b2 = b3 = b4 = 0, and iii) the standard deviation of the residuals for the full model. f) Using the regression sums of squares information, test the null hypothesis H0:b2 = b4 = 0 for the full model.…arrow_forward
- A survey of 28 employed workers found that the correlation coefficient between the number of years of post-secondary education and current annual income in dollars is -0.38. The researchers hypothesize a positive relationship between number of years of post-secondary education and annual income. What can the researchers conclude with α = 0.05? a) Obtain/compute the appropriate values to make a decision about H0. critical value= test statistic= b) effect size= C) 1)There is a significant positive relationship between years of post-secondary education and current annual income. 2)There is a significant negative relationship between years of post-secondary education and current annual income. 3) There is no significant relationship between years of post-secondary education and current annual income.arrow_forwardIn a study investigating maternal risk factors for congenital syphilis, syphilis is treated as a binary outcome variable, where 1 represents the presence of disease in a newborn and 0 represents absence of disease. The estimated coefficients from a logistic regression model containing the predictors cocaine or crack use, marital status, number of prenatal visits to a doctor, alcohol use and level of education are included in the table below. The estimated intercept is not included in the table. Variable Coefficient Cocaine/Crack Use 1.354 Marital Status 0.779 Number of Prenatal Visits -0.098 Alcohol Use 0.723 Level of Education 0.298 The estimated coefficient of cocaine or crack use has a standard error of 0.162. Construct a 95% confidence interval for the population odds ratio comparing women who used cocaine or crack versus those who did not. Conduct a test of the null hypothesis that the coefficient associated with cocaine or crack use is…arrow_forwardIn a study conducted in the Science Department of Faculty of Science, Technology and Human Development in a University; the researcher examined the influence of the drug succinylcholine on the circulation levels of androgens in the blood. Blood samples from wild, free-ranging deer were obtained via the jugular vein immediately after an intramuscular injection of succinylcholine using darts and a capture gun. Deer were bled again approximately 30 minutes after the injection and then released. The level of androgens at time of capture and 30 minutes later, measured in nanograms per milliliter (ng/ml), for 15 deers as in Table Q1. Assuming that the populations of androgen at time of injection and 30 minutes later are normally distributed:i) Find the average and standard deviation of this studyii)Determine the critical region of this problem.iii) Test at the 0.05 level of significance whether the androgen concentrations are altered after 30 minutes of restraint.arrow_forward
- A cohort study is conducted to assess the association between clinical characteristics and the risk of stroke. The study involves n=1,250 participants who are free of stroke at the study start. Each participant is assessed at study start (baseline) and every year thereafter for five years. The following table displays data on hypertensive status measured at baseline and incident stroke over 5 years. Free of Stroke at 5 Years Stroke Baseline: Not Hypertensive 952 46 Baseline: Hypertensive 234 18 Compute the risk difference of stroke (per 5 person-years) for patients with hypertension as compared to patients free of hypertension.arrow_forwardBlood cocaine concentration (mg/L) was determinedboth for a sample of individuals who had died fromcocaine-induced excited delirium (ED) and for a sampleof those who had died from a cocaine overdose withoutexcited delirium; survival time for people in bothgroups was at most 6 hours. The accompanying datawas read from a comparative boxplot in the article“Fatal Excited Delirium Following Cocaine Use” (J.of Forensic Sciences, 1997: 25–31). ED 0 0 0 0 .1 .1 .1 .1 .2 .2 .3 .3.3 .4 .5 .7 .8 1.0 1.5 2.7 2.83.5 4.0 8.9 9.2 11.7 21.0Non-ED 0 0 0 0 0 .1 .1 .1 .1 .2 .2 .2.3 .3 .3 .4 .5 .5 .6 .8 .9 1.01.2 1.4 1.5 1.7 2.0 3.2 3.5 4.14.3 4.8 5.0 5.6 5.9 6.0 6.4 7.98.3 8.7 9.1 9.6 9.9 11.0 11.512.2 12.7 14.0 16.6 17.8 a. Determine the medians, fourths, and fourth spreadsfor the two samples.b. Are there any outliers in either sample? Any extremeoutliers?c. Construct a comparative boxplot, and use it as abasis for comparing and contrasting the ED andnon-ED samples.arrow_forwardThe Update to the Task Force Report on Blood Pressure Control in Children [12] reported the observed 90th per-centile of SBP in single years of age from age 1 to 17 based on prior studies. The data for boys of average height are given in Table 11.18. Suppose we seek a more efficient way to display the data and choose linear regression to accomplish this task. age sbp 1 99 2 102 3 105 4 107 5 108 6 110 7 111 8 112 9 114 10 115 11 117 12 120 13 122 14 125 15 127 16 130 17 132 Do you think the linear regression provides a good fit to the data? Why or why not? Use residual analysis to justify your answer. Am I supposed to run a residual plot and QQ-plot for this question?arrow_forward
- Consider a regression study involving a dependent variable y, a quantitative independent variable x1, and a categorical independent variable with three possible levels (level 1, level 2, and level 3). (i) How many dummy variables are required to represent the categorical variable? (ii) Write a multiple regression equation relating x1, and the categorical variable to y. PLEASE SHOW ALL HAND WRITTEN STEPS AND DO NOT USE EXCEL OR ANY SOFTWAREarrow_forwardFrom the article “Association of cognitive functioning with retinal nerve fiber layer thickness” by van Koolwijk et al., in Investigative Ophthalmology & Visual Science, October 2009, Vol. 50, No. 10, below is table 2 showing the results of fitting several multiple linear regression models for different response variables. Write down the fitted model corresponding to the last row of the table. You can leave the intercept as hatB0. Interpret the coefficient values corresponding to the RNFL Thickness and Male variables.arrow_forwardA study is conducted to determine if there is a relationship between the two variables, blood haemoglobin (Hb) levels and packed cell volumes (PCV) in the female population. A simple linear regression analysis was performed using SPSS. Based on the SPSS output of the ANOVA table, which of the following statements is the CORRECT interpretation? 1. The regression model statistically significantly predicts the blood haemoglobin level. 2. About 39.98 % of variance in Hb is explained by PCV. 3. The regression model does not fit the data. 4. There is significant contribution of Hb towards PCV.arrow_forward
arrow_back_ios
SEE MORE QUESTIONS
arrow_forward_ios
Recommended textbooks for you
 MATLAB: An Introduction with ApplicationsStatisticsISBN:9781119256830Author:Amos GilatPublisher:John Wiley & Sons Inc
 Probability and Statistics for Engineering and th...StatisticsISBN:9781305251809Author:Jay L. DevorePublisher:Cengage Learning
 Statistics for The Behavioral Sciences (MindTap C...StatisticsISBN:9781305504912Author:Frederick J Gravetter, Larry B. WallnauPublisher:Cengage Learning
 Elementary Statistics: Picturing the World (7th E...StatisticsISBN:9780134683416Author:Ron Larson, Betsy FarberPublisher:PEARSON
 The Basic Practice of StatisticsStatisticsISBN:9781319042578Author:David S. Moore, William I. Notz, Michael A. FlignerPublisher:W. H. Freeman
 Introduction to the Practice of StatisticsStatisticsISBN:9781319013387Author:David S. Moore, George P. McCabe, Bruce A. CraigPublisher:W. H. Freeman
MATLAB: An Introduction with Applications
Statistics
ISBN:9781119256830
Author:Amos Gilat
Publisher:John Wiley & Sons Inc
Probability and Statistics for Engineering and th...
Statistics
ISBN:9781305251809
Author:Jay L. Devore
Publisher:Cengage Learning
Statistics for The Behavioral Sciences (MindTap C...
Statistics
ISBN:9781305504912
Author:Frederick J Gravetter, Larry B. Wallnau
Publisher:Cengage Learning
Elementary Statistics: Picturing the World (7th E...
Statistics
ISBN:9780134683416
Author:Ron Larson, Betsy Farber
Publisher:PEARSON
The Basic Practice of Statistics
Statistics
ISBN:9781319042578
Author:David S. Moore, William I. Notz, Michael A. Fligner
Publisher:W. H. Freeman
Introduction to the Practice of Statistics
Statistics
ISBN:9781319013387
Author:David S. Moore, George P. McCabe, Bruce A. Craig
Publisher:W. H. Freeman
what is Research Design, Research Design Types, and Research Design Methods; Author: Educational Hub;https://www.youtube.com/watch?v=LpmGSioXxdo;License: Standard YouTube License, CC-BY