
Concept explainers
Videos
Cigarette smoking has important health consequences and is positively associated with heart and lung diseases. Less well known are the consequences of quitting smoking. A group of 10 nurses, from the Nurses’ Health Study, ages 50−54 years, had smoked at least 1 pack per day and quit for at least 6 years. The nurses reported their weight before and 6 years after quitting smoking. A commonly used measure of obesity that takes height and weight into account is BMI = wt/ht2 (in units of kg/m2). The BMI of the 10 women before and 6 years after quitting smoking are given in the last 2 columns of Table 8.32.
Table 8.32 BMI change in 50- to 54-year-old women over a 6-year period
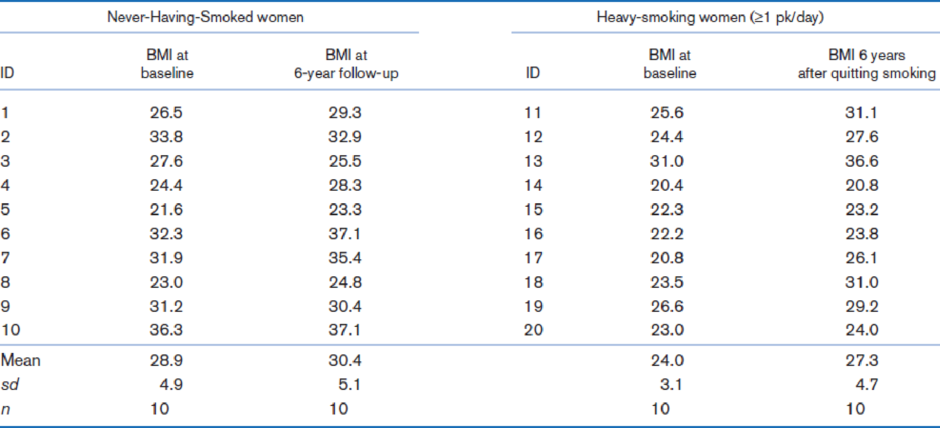
What test can be used to assess whether the mean change in BMI over 6 years is different between women who quit smoking and women who have never smoked?

Trending nowThis is a popular solution!

Chapter 8 Solutions
EBK FUNDAMENTALS OF BIOSTATISTICS


- Find the mean hourly cost when the cell phone described above is used for 240 minutes.arrow_forwardEach year the US Environmental Protection Agency (EPA) releases fuel economy data on cars manufactured in that year. Below are summary statistics on fuel efficiency (in miles/gallon for city driving) from random samples of cars with manual and automatic transmissions manufactured in 2012. We want to know if there is a statistical difference between the average fuel efficiencies between the two different types of transmission. Automatic Transmission Manual Transmission X1 = 15.7 Si = 3.6 N1 = 26 T2 = 19 S2 = 4.65 N2 = 34 Mean %3D SD Sample Size (a) Calculate the standard error for the appropriate sampling distribution: SE = (b) We want to calculate a 91% confidence interval for the difference between the gas mileages for the automatic transmission and the manual transmission cars. What is the critical t-score that we should use to build our confidence interval? tcritical (c) Calculate the margin of error, the lower bound, and the upper bound for the 91% confidence interval. Margin of…arrow_forwardRide services are on the rise, such as Uber and Lyft. You wondered if the recent news reports of crime occurring with these ride services impacted the usage of them, especially with women. You decide to conduct a survey about ride service usage among male and female college students. The results showed that 19 males use ride services and 11 do not. While 12 females use ride services and 18 do not. Calculate the chi-square statistic:arrow_forward
- I surveyed a sample of 68 customers in a business to see how much they spend in there. Would this result in a parameter or a statistic? Explain your answer.arrow_forwardDo you have enough good cholesterol?” High density lipoprotein (HDL) is sometimes called the “good cholesterol” because high values are associated with a reduced risk of heart disease. According to the American Heart Association, people over the age of 20 years should have at least 40 milligrams per deciliter (mg/dl) of HDL cholesterol. U.S. women aged 20 and over have a mean HDL of 55 mg/dl with a standard deviation of 15.5 mg/dl. Assume that the distribution is normal. A. What percent of women have low values of HDL (40 mg/dl or less?) B. HDL levels of 60mg/dl or higher are believed to protect people from heart disease. What percent of women have protective levels of HDL? C. Women with more than 40mg/dl but less than 60 mg/dl of HDL are in the intermediate range, neither very good or very bad. What proportion are in this category?arrow_forwardAverage adult Americans are about one inch taller, but nearly a whopping 25 pounds heavier than they were in 1960, according to a new report from the Centers for Disease Control and Prevention (CDC). The bad news, says CDC is that average BMI (body mass index, a weight-for-height formula used to measure obesity) has increased among adults...” Boston is considered one of America’s healthiest cities – is the weight gain since 1960 similar in Boston? A sample of n=28 adults suggested a mean increase of 19.5 pounds over the mean recorded in 1960 with a standard deviation of 8.6 pounds. Is Boston statistically significantly different in terms of weight gain from the national mean since 1960? Run the appropriate test at a 5% level of significance. Please use the five steps to demonstrate proper hypothesis testing and explain your results. Please do not use any software calculations.arrow_forward
- helparrow_forwardA college administrator wants to know if there is a significant difference between sexual orientation and level of family support for students at their college. The administrator takes a random sample of students who identify as gay/lesbian, bisexual or heterosexual/straight. There were 22 students sampled in each category. A measure of family support is given with higher scores indicating more family support. The means are as follows: Gay/lesbian Bisexual Heterosexual/Straight MG/L = 16 MBi = 17 MH/S = 22 Source SS df MS F Orientation 300 Error 2961 Total What is the value of df orientation?arrow_forward
 Glencoe Algebra 1, Student Edition, 9780079039897...AlgebraISBN:9780079039897Author:CarterPublisher:McGraw Hill
 College Algebra (MindTap Course List)AlgebraISBN:9781305652231Author:R. David Gustafson, Jeff HughesPublisher:Cengage Learning
 Big Ideas Math A Bridge To Success Algebra 1: Stu...AlgebraISBN:9781680331141Author:HOUGHTON MIFFLIN HARCOURTPublisher:Houghton Mifflin Harcourt
 Holt Mcdougal Larson Pre-algebra: Student Edition...AlgebraISBN:9780547587776Author:HOLT MCDOUGALPublisher:HOLT MCDOUGAL