
Concept explainers
Videos
A study was conducted of genetic and environmental influences on cholesterol levels. The data set used for the study were obtained from a twin registry in Sweden [10]. Specifically, four populations of adult twins were studied: (1) monozygotic (MZ) twins reared apart, (2) MZ twins reared together, (3) dizygotic (DZ) twins reared apart, and (4) DZ twins reared together. One issue is whether it is necessary to correct for gender before performing more complex genetic analyses. The data in Table 8.17 were presented for total cholesterol levels for MZ twins reared apart, by gender.
Table 8.17 Comparison of mean total cholesterol for MZ twins reared apart, by gender
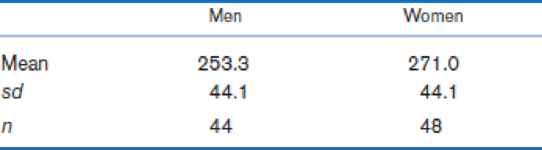
Note: n = number of people (e.g., for males, 22 pairs of twins = 44 people) the cholesterol levels within each sample consist of independent observation.
If we assume (a) serum cholesterol is
Want to see the full answer?
Check out a sample textbook solution
Chapter 8 Solutions
EBK FUNDAMENTALS OF BIOSTATISTICS


- What is meant by the sample space of an experiment?arrow_forwardWhat is an experiment?arrow_forwardAn important issue is whether there are racial differences in hypertension among children. We define hypertension as being above the 95th percentile for either systolic blood pressure (SBP) or diastolic blood pressure (DBP) among children of the same age, height, and sex. Since some of the children were observed at multiple visits, a GEE model was run of hypertension on ethnic group. There were three ethnic groups considered: Caucasian, African American, and Hispanic. The results among boys are given in Table 13.54. TABLE 13.54 Relationship between hypertension and ethnic group among 27,009 boys in the Pediatric Task Force Data Variable Regression Coefficient SE Intercept -2.07 0.026 African American 0.049 0.041 Hispanic 0.328 0.059 What is the estimated OR for hypertension comparing Hispanic boys vs. Caucasian boys? (Call this OR1.) What is a 95% CI for this estimate?arrow_forward
- The Joint Commission on Accreditation of Healthcare Organizations mandated that hospitals ban smoking by 1994. To study the effects of this ban on smoking behaviors, subjects were randomly selected from two different populations: those from hospitals with the ban and those from hospitals without the ban. Investigators were interested in determining if this smoking ban had any impact on the proportion of smokers employed at each hospital that then quit smoking. Let px be the proportion of smokers from hospitals that implemented the ban who quit smoking during the study period. Let py be the proportions of smokers from hospitals without the ban who quit smoking during the study period. Please select the appropriate hypotheses. H0: px = 0.50 HA: px ≠ 0.50 H0: px-py ≥ 0 HA: px-py H0: px-py ≤ 0 HA: px-py > 0 H0: px-py = 0 HA: px-py ≠ 0arrow_forwardWhich of the following best describes what a meta-analysis is. A) Human subjects are chosen and randomized into either an experimental group or a control group. B) An analysis that combines/summarizes the results of several separate but similar studies in order to evaluate results from the combined data. C) A study that is typically performed on animals to understand how chemical components affect our diet and healtharrow_forwardIs gender independent of education level ? A random sample of 395 people were surveyed and each person was asked to report the highest education level they obtained .The data that resulted from the survey is summarized in the following table: High School Bachelors Masters PhD. Female 60 54 46 41 Male 40 44 53 57 Question: Are gender and education level dependent at 5percent level of significance ? In other words given the data collected above is there a relationship between the gender of an individual and the level of education that they have obtained ?arrow_forward
- In a study of violent victimization of women and men, Porcerelli et al. (A-2) collected information from 679 women and 345 men aged 18 to 64 years at several family practice centers in the metropolitan Detroit area. Patients filled out a health history questionnaire that included a question about victimization. The following table shows the sample subjects cross-classified by sex and the type of violent victimization reported. The victimization categories are defined as no victimization, partner victimization (and not by others), victimization by persons other than partners (friends, family members, or strangers), and those who reported multiple victimization. No Victimization Partners Nonpartners Multiple Victimization Total Women 611 34 16 18 679 Men 308 10 17 10 345 Total 919 44 33 28 1024 Source: Data provided courtesy of John H. Porcerelli, Ph.D., Rosemary Cogan, Ph.D. (a) Suppose we pick a subject at random from this group. What is the probability that this subject will be a…arrow_forwardIn a study of violent victimization of women and men, Porcerelli et al. (A-2) collected information from 679 women and 345 men aged 18 to 64 years at several family practice centers in the metropolitan Detroit area. Patients filled out a health history questionnaire that included a question about victimization. The following table shows the sample subjects cross-classified by sex and the type of violent victimization reported. The victimization categories are defined as no victimization, partner victimization (and not by others), victimization by persons other than partners (friends, family members, or strangers), and those who reported multiple victimization. No Victimization Partners Nonpartners Multiple Victimization Total Women 611 34 16 18 679 Men 308 10 17 10 345 Total 919 44 33 28 1024 Source: Data provided courtesy of John H. Porcerelli, Ph.D., Rosemary Cogan, Ph.D. (d) If we pick a subject at random, what is the probability that the subject will be a woman and have…arrow_forwardA case−control study was performed among 145 subjects with macular degeneration and 34 controls, all of whom were 70- to 79-year-old women. A genetic risk score was developed to help differentiate the cases from the controls. The risk score was categorized into six groups (1, 2, 3, 4, 5, 6), with 6 being the highest risk and 1 being the lowest risk.The data in Table 10.48 were obtained relating the risk score to case/control status. taBlE 10.48 risk score cases controls 1 3 11 2 7 3 3 6 6 4 10 8 5 11 2 6 108 4 total 145 34 10.139 What test can be performed to study the asso- ciation between case/control status and risk score? Spe- cifically, we are interested in testing whether cases tend to have consistently higher risk scores or consistently lower risk scores than controls.arrow_forward
- Eighteen participants took part in an experimental study that consisted of three levels: normal classroom teaching, normal classroom teaching with tutors, and an experimental teaching method to increase student scores on a statistics exam. Your data set includes the following variables: Treatment (1 - normal classroom teaching; 2 - normal classroom teaching with tutors; 3 - experimental teaching method) Gender (1 – female; 2 – male) Pre-test score (higher scores represent better student performance on a statistics exam) Post-test score (higher scores represent better student performance on a statistics exam) Stanford-Binet Intelligence Test scores (IQ) The number of hours the student studied per week. Do test scores at pre-treatment differ from test scores at post-treatment? Note, this analysis should be conducted ignoring the treatment group they are in. Select an appropriate statistical test and state teh hullhypothesis.arrow_forwardThe Framingham Heart Study was a longitudinal cohort study of 5000+ men and women. One outcome of interest was fasting glucose levels. Glucose levels were categorized into three different categories: Glucose Levels -Diabetes (glucose > 126), -Impaired Fasting Glucose (glucose 100-125), -Normal Glucose Several possible risk factors were also recorded: Risk Factors -Sex -Age -BMI (normal weight, overweight, obese) -Genetics To determine if each possible risk factor is related to glucose levels, researchers need to use an appropriate hypothesis test. Use Table 7-50 on page 161 of the textbook to select the correct test from the gray box above. What test would be used to assess whether the different sexes (male and female) have the same proportions of the different glucose levels? What test would be used to assess whether the different glucose levels have the same mean age? What test would be used to assess whether the different categories of BMI…arrow_forwardAs men age, their testosterone levels gradually decrease. This may cause a reduction in energy, an increase in fat, and other undesirable changes. Do testosterone supplements reverse some of these effects? A study in the Netherlands assigned 237 men aged 60 to 80 with low or low-normal testosterone levels to either a testosterone supplement or a placebo. Why is it necessary to include a control group in this experiment? Every experiment needs a control group in order to make proper comparisons between treatments. A control group is necessary to balance the effects of other variables among the treatment groups. A control group is necessary so any differences in the effects of the treatments can be distinguished from chance differences between the groups. A control group helps avoid confounding and reduces variability in the response variable. A control group is used to provide a baseline for comparing the effects of other treatments.arrow_forward
 Big Ideas Math A Bridge To Success Algebra 1: Stu...AlgebraISBN:9781680331141Author:HOUGHTON MIFFLIN HARCOURTPublisher:Houghton Mifflin Harcourt
 Glencoe Algebra 1, Student Edition, 9780079039897...AlgebraISBN:9780079039897Author:CarterPublisher:McGraw Hill
 College Algebra (MindTap Course List)AlgebraISBN:9781305652231Author:R. David Gustafson, Jeff HughesPublisher:Cengage Learning