
Concept explainers
Videos
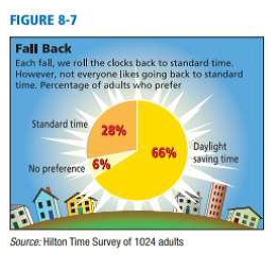
Examine Figure 8-7. “Fall Back "
(a) Of the 1024 adults surveyed, 66% mere reported to favor daylight saving time. How many people in the sample preferred daylight saving time? Using the statistic
(b) Look at Figure 8-7 to find the sample statistic
Want to see the full answer?
Check out a sample textbook solution
Chapter 8 Solutions
Understanding Basic Statistics


- A recent study by the McGraw-Hill company showed that 61% (1621) of college students use their smartphones for studying. The sample size for this poll was 2657 students. Create a 95% confidence interval for the true proportion of all college students who use their smartphones to study. Round to two decimal places.arrow_forwardSuppose we take a SRS of high school seniors and get a 95% confidence interval that 250 to 278 seniors plan to attend prom. What is the point estimator and margin of error?arrow_forwardA random sample of 300 high school students in a particular town showed that 165 smoke on a regular basis. Find the 95% confidence interval estimating the population percentage for smokers at this high school.arrow_forward
- In a sample of 10 randomly selected women. It was found that their mean height was 63.4 inches. From previous studies, it can be assumed that the population standard deviation is 2.4 and that the population of height measurements is normally distributed. Construct the 95% confidence intervalarrow_forwardIn the year 2017, the mean and standard deviation for the quality grade point average of the first-year students in a basic statistics course is found to be 2.95 and 0.53. If 38 undergraduates are randomly selected, find the 95% confidence interval for the mean of the entire group. Within the same year, if another group of 38 students were sampled and resulted with a mean of 2.87, test the hypothesis that the sample mean is different from the population mean at a 5% level of significance.arrow_forwardIn a random sample of 250 high school students, it was found that 85.2% (213) of them later graduated. The 95% confidence interval is (-0.065,0.065) and the 98% confidence interval is (-0.077,0.077) for the true proportion of all high school students who graduate. Compare the two proportions.arrow_forward
- A random sample of 40 students taken from a university showed that their mean GPA is 2.94 and the standard deviation of their GPAs is .30. Construct a 99% confidence interval for the mean GPA of all students at this university.arrow_forwardThere is a sample of 30 people and their shower times. What is the 95% confidence interval when sample mean is 23.50 minutes and standard deviation is 9.69 minutes?arrow_forwardFrom an SRS of 600 U.S. adults, 116 live in a multigenerational household (multiple generation under one roof) 3. Find the Margin Error for a 95% confidence interval of the population proportion of U.S. adults that live in a multigenerational household Round your answer to the nearest ten-thousandth (4 decimal places).arrow_forward
- A random sample of 1700 workers in a particular city found 646 workers who had full health insurance coverage. Find a 95% confidence interval for the true percent of workers in this city who have full health insurance coverage. Express your results to the nearest hundredth of a percent. Answer: ____________ to _____%arrow_forwardA sample of 15 students was used to estimate the performance of graduates of a certain college on a standardized test taken by all the students of the college.It was found that the sample average score of these 15 students on the test was 85 with a sample standard deviation of 15. What would be the 95% confidence interval for the average score of the whole college population? If instead, it is known that this sample of 15 students was taken only from a specific section of a class containing 30 students, what would be the 95% confidence interval for the average score of this class on this test?arrow_forwardThe heights of a random sample of 20 college students showed a mean of 174.5 centimetersand a standard deviation of 6.9 centimeters. Construct a 98% confidence interval for themean height of all college students?arrow_forward
 MATLAB: An Introduction with ApplicationsStatisticsISBN:9781119256830Author:Amos GilatPublisher:John Wiley & Sons Inc
 Probability and Statistics for Engineering and th...StatisticsISBN:9781305251809Author:Jay L. DevorePublisher:Cengage Learning
 Statistics for The Behavioral Sciences (MindTap C...StatisticsISBN:9781305504912Author:Frederick J Gravetter, Larry B. WallnauPublisher:Cengage Learning
 Elementary Statistics: Picturing the World (7th E...StatisticsISBN:9780134683416Author:Ron Larson, Betsy FarberPublisher:PEARSON
 The Basic Practice of StatisticsStatisticsISBN:9781319042578Author:David S. Moore, William I. Notz, Michael A. FlignerPublisher:W. H. Freeman
 Introduction to the Practice of StatisticsStatisticsISBN:9781319013387Author:David S. Moore, George P. McCabe, Bruce A. CraigPublisher:W. H. Freeman