
Videos
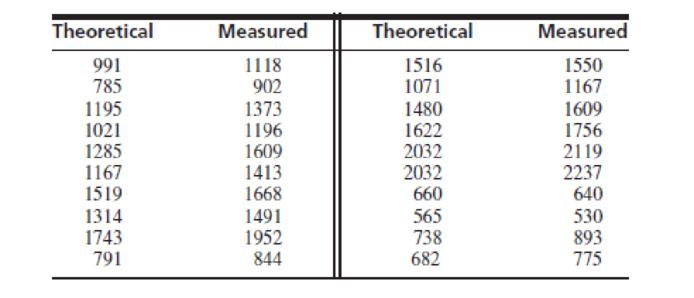
The article “Ultimate Load Analysis of Plate Reinforced Concrete Beams” (N. Subedi and P. Baglin, Engineering Structures, 2001:1068–1079) presents theoretical and measured ultimate strengths (in kN) for a sample of steel-reinforced concrete beams. The results are presented in the following table (two outliers have been deleted).
Let y denote the measured strength, x the theoretical strength, and t the true strength, which is unknown. Assume that y = t + ε, where ε is the measurement error. It is uncertain whether t is related to x by a linear model t = β0 + β1x or by a quadratic model t = β0 + β1x + β2x2.
- a. Fit the linear model y = β0 + β1x + ε. For each coefficient, find the P-value for the null hypothesis that the coefficient is equal to 0.
- b. Fit the quadratic model y = β0 + β1x + β2x2 + ε. For each coefficient, find the P-value for the null hypothesis that the coefficient is equal to 0.
- c. Plot the residuals versus the lilted values for the linear model.
- d. Plot the residuals versus the fitted values for the quadratic model.
- e. c. Based on the results in parts (a) through (d), which model seems more appropriate? Explain.
- f. Using the more appropriate model, estimate the true strength if the theoretical strength is 1500.
- g. Using the mom appropriate model, find a 95% confidence interval for the true strength if the theoretical strength is 1500.
Want to see the full answer?
Check out a sample textbook solution
Chapter 8 Solutions
Statistics for Engineers and Scientists (Looseleaf)
Additional Math Textbook Solutions
Intro Stats, Books a la Carte Edition (5th Edition)
Essential Statistics
Elementary Statistics Using Excel (6th Edition)
EBK STATISTICAL TECHNIQUES IN BUSINESS
Business Analytics
Statistics: Informed Decisions Using Data (5th Edition)


- A recent poll found that 664 out of 1026 randomly selected people in a particular country felt that colleges and universities with big sports programs placed too much emphasis on athletics over academics. Assuming the conditions for the CLT are met, use the accompanying Minitab output to complete parts a and b below. N Event Sample p 95% CI for p 1026 664 0.647173 (0.617934, 0.676413) Question content area bottom b. Suppose a sports blogger wrote an article claiming that a majority of adults from this country believe that colleges and universities with big sports programs place too much emphasis on athletics over academics. Does this confidence interval support the blogger's claim? Explain your reasoning. A. No, it is not a plausible claim because the confidence interval contains 50%. B. No, it is not a plausible claim because the confidence interval does not contain only values above 50%. C. Yes, it is a…arrow_forwardThe authors of the article “Predictive Model for PittingCorrosion in Buried Oil and Gas Pipelines”(Corrosion, 2009: 332–342) provided the data on whichtheir investigation was based.a. Consider the following sample of 61 observations onmaximum pitting depth (mm) of pipeline specimensburied in clay loam soil. 0.41 0.41 0.41 0.41 0.43 0.43 0.43 0.48 0.480.58 0.79 0.79 0.81 0.81 0.81 0.91 0.94 0.941.02 1.04 1.04 1.17 1.17 1.17 1.17 1.17 1.171.17 1.19 1.19 1.27 1.40 1.40 1.59 1.59 1.601.68 1.91 1.96 1.96 1.96 2.10 2.21 2.31 2.462.49 2.57 2.74 3.10 3.18 3.30 3.58 3.58 4.154.75 5.33 7.65 7.70 8.13 10.41 13.44Construct a stem-and-leaf display in which the twolargest values are shown in a last row labeled HI.b. Refer back to (a), and create a histogram based oneight classes with 0 as the lower limit of the firstclass and class widths of .5, .5, .5, .5, 1, 2, 5, and 5,respectively.c. The accompanying comparative boxplot fromMinitab shows plots of pitting depth for four differenttypes of soils.…arrow_forwardSuppose a researcher is interested inthe effectiveness in a new childhood exercise program implemented in a SRS of schools across a particular county. In order to test the hypothesis that the new program decreases BMI (Kg/m2), the researcher takes a SRS of children from schools where the program is employed and a SRS from schools that do not employ the program and compares the results. Assume the following table represents the SRSs of students and their BMIs. Student intervention group BMI (kg/m2) Student control group BMI (kg/m2) A 18.6 A 21.6 B 18.2 B 18.9 C 19.5 C 19.4 D 18.9 D 22.6 E 24.1 F 23.6 A) Assuming that all the necessary conditions are met (normality, independence, etc.) carry out the appropriate statistical test to determine if the new exercise program is effective. Use an alpha level of 0.05. Do not assume equal variances.B) Construct a 95% confidence interval about your estimate for the average difference in BMI between the groups.arrow_forward
- An article in Knee Surgery, Sports Traumatology, Arthroscopy (2005, Vol. 13, pp. 273-279) considered arthroscopic meniscal repair with an absorbable screw. Results showed that for tears greater than 25 millimeters, 14 of 18 (78%) repairs were successful, but for shorter tears, 22 of 30 (73%) repairs were successful. A doctor would like to know if there is evidence that the success rate is greater for longer tears. The P-value for the test H0: p1 = p2 versus H1: p1 > p2 is closest to:arrow_forwardDo the results of your hypothesis test provide evidence that penetration of Fuentes’ Candied Bacon Potato Chips in grocery stores differs across its eight U.S. sales regions? In which sales region(s) is penetration of Fuentes’ Candied Bacon Potato Chips lower or higher than expected? Use the Marascuilo pairwise comparison procedure at a 5 .05 to test for differences between regions. New England Mid-Atlantic Midwest Great Plains South Atlantic Deep South Mountain Pacific Yes Yes No No Yes Yes Yes No No Yes Yes Yes Yes Yes Yes No Yes Yes No Yes No Yes No No Yes No Yes Yes Yes Yes Yes No Yes Yes No Yes Yes Yes No Yes No No No Yes No Yes No No Yes Yes Yes Yes Yes Yes Yes No No Yes Yes No Yes No Yes Yes Yes No No No Yes Yes Yes Yes Yes No No Yes Yes Yes No No Yes Yes Yes Yes Yes Yes No Yes Yes No No Yes Yes No Yes No No Yes Yes Yes Yes Yes No No No Yes Yes Yes Yes Yes Yes Yes Yes Yes Yes Yes Yes Yes No Yes No Yes No No Yes Yes No No No Yes No Yes Yes…arrow_forwardThe article “Structural Performance of Rounded Dovetail Connections Under Different Loading Conditions” (T. Tannert, H. Prion, and F. Lam, Can J Civ Eng, 2007:1600–1605) describes a study of the deformation properties of dovetail joints. In one experiment, 10 rounded dovetail connections and 10 double rounded dovetail connections were loaded until failure. The rounded connections had an average load at failure of 8.27 kN with a standard deviation of 0.62 kN. The double-rounded connections had an average load at failure of 6.11 kN with a standard deviation of 1.31 kN. Can you conclude that the mean load at failure is greater for rounded connections than for double-rounded connections?arrow_forward
- Suppose that we want to compare the cholestrol contents of four competing diet foods on the basis of the following data (in milligrams per package) which were obtained for three 6-ounce packages of each of the diet foods: Diet food A: 3.6 4.1 4.0 Diet food B: 3.1 3.2 3.9 Diet food C: 3.2 3.5 3.5 Diet food D: 3.5 3.8 3.8 Fill in the blanks below. Test at the 0.05 level of significance whether the differences among means obtained for the four competing diet foods (Diet A, B, C, D) are significant? (Ftable=4.07) source of varation degrees of freedom sum of squares mean squares F treatments ? 0.54 ? ? error ? ? ? total ? 1.18arrow_forwardThe article “Hydrogeochemical Characteristics of Groundwater in a Mid-Western CoastalAquifer System” (S. Jeen, J. Kim, et al., Geosciences Journal, 2001:339–348) presentsmeasurements of various properties of shallow groundwater in a certain aquifer system inKorea. Following are measurements of electrical conductivity (in microsiemens percentimeter) for 23 water samples.2099 528 2030 1350 1018 384 14991265 375 424 789 810 522 513488 200 215 486 257 557 260461 500Find the mean.Find the standard deviation.Find the median.Construct a dotplot.Find the 10% trimmed mean.Find the first quartile.Find the third quartile.Find the interquartile range.Construct a boxplot.Which of the points, if any, are outliers?If a histogram were constructed, would it be skewed to the left, skewed to the right, orapproximately symmetric?arrow_forwardThe number of contaminating particles on a silicon waferprior to a certain rinsing process was determined for eachwafer in a sample of size 100, resulting in the followingfrequencies:Number of particles 0 1 2 3 4 5 6 7Frequency 1 2 3 12 11 15 18 10Number of particles 8 9 10 11 12 13 14Frequency 12 4 5 3 1 2 1a. What proportion of the sampled wafers had at leastone particle? At least five particles?b. What proportion of the sampled wafers had betweenfive and ten particles, inclusive? Strictly between fiveand ten particles?c. Draw a histogram using relative frequency on thevertical axis. How would you describe the shape of thehistogram?arrow_forward
- In a breeding experiment, chicken with white feathers, small comb were mated and the offspring categories white feathers, small comb (WS), white feathers. large comb (WL), dark feathers, small comb (DS) and dark feathers, large comb (DL) were expected to follow the ratio 9:3:3:1 the researcher observed that there were 100 WS, 32 WL, 40 DS and 20 DL offspring. In order to test if the observed frequencies follow the expected ratio, what should be the hull hypothesis?A. P(WS) = 100/192, P(WL) = 32/192, P(DS) = 40/192 , P(DL) = 20/192 B. P(WS) = 100 , P(WL) = 32, P(DS) = 40, P(DL) = 20 C. P(WS) = 9/16 , P(WL) = 3/16, P(DS) = 3/16, P(DL) = 1/16 D. P(WS) = 9, P(WL) = 3, P(DS) = 3 , P(DL) = 1 2. In Problem 1, what would be the degree of freedom for an appropriate test?A.2 B.3 C.4 D.1 3. What is the value of the computed test statistic in problem 1? A.7.81 B.3.84 C.6.81 D.5.99 5.What would be the p-value for this test in problem 1? A.0.28 B.0.05 C.0.08 D. 0.11 6. At 5-% level of significance,…arrow_forwardAn article in the Journal of Quality Technology (Vol. 13, No. 2, 1981, pp. 111–114) describes an experimentthat investigates the effects of four bleaching chemicals on pulp brightness. These four chemicals wereselected at random from a large population of potential bleaching agents. The data are as follows:a. Test the significance of these chemical types with α=0.05.b. If proven significant, perform a multiple comparison method using Fisher’s LSDarrow_forwardThe table below shows the numbers of bushels of barley cultivated per acre for 12 one-acre plots of land for two different strains of barley, PHT-34 and CBX-21. PHT-34 CBX-21 43 55 49 46 47 43 38 44 47 45 45 49 50 47 46 59 46 52 46 49 45 48 43 51 Determine the minimum data value, the quartiles, and the maximum data value for the PHT-34 and CBX-21 data sets. PHT-34 CBX-21 min Q1 Q2 Q3 maxarrow_forward
 MATLAB: An Introduction with ApplicationsStatisticsISBN:9781119256830Author:Amos GilatPublisher:John Wiley & Sons Inc
 Probability and Statistics for Engineering and th...StatisticsISBN:9781305251809Author:Jay L. DevorePublisher:Cengage Learning
 Statistics for The Behavioral Sciences (MindTap C...StatisticsISBN:9781305504912Author:Frederick J Gravetter, Larry B. WallnauPublisher:Cengage Learning
 Elementary Statistics: Picturing the World (7th E...StatisticsISBN:9780134683416Author:Ron Larson, Betsy FarberPublisher:PEARSON
 The Basic Practice of StatisticsStatisticsISBN:9781319042578Author:David S. Moore, William I. Notz, Michael A. FlignerPublisher:W. H. Freeman
 Introduction to the Practice of StatisticsStatisticsISBN:9781319013387Author:David S. Moore, George P. McCabe, Bruce A. CraigPublisher:W. H. Freeman