
Concept explainers
Videos
(a)
To calculate the probability distribution of X .
(a)
Answer to Problem 8.54E
| X | 0 | 1 | 2 | 3 | 4 | 5 | 6 | 7 |
| Probability | 0.0173 | 0.095 | 0.2239 | 0.2932 | 0.2304 | 0.1086 | 0.0284 | 0.0032 |
Explanation of Solution
Binomial theorem:
Now,
The probability distribution is:
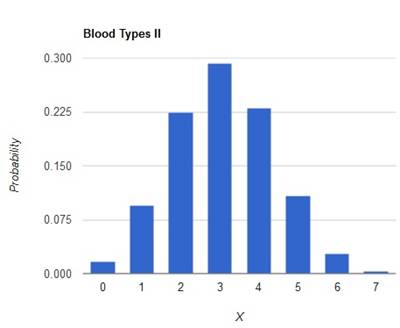
| X | 0 | 1 | 2 | 3 | 4 | 5 | 6 | 7 |
| Probability | 0.0173 | 0.095 | 0.2239 | 0.2932 | 0.2304 | 0.1086 | 0.0284 | 0.0032 |
(b)
To construct the graph of probability distribution of X .
(b)
Explanation of Solution
The graph is as follows:
Chapter 8 Solutions
Statistics Through Applications
Additional Math Textbook Solutions
Introductory Statistics
Elementary Statistics
Elementary Statistics Using Excel (6th Edition)
Statistics: The Art and Science of Learning from Data (4th Edition)
Statistics for Psychology
Elementary Statistics: Picturing the World (7th Edition)


 MATLAB: An Introduction with ApplicationsStatisticsISBN:9781119256830Author:Amos GilatPublisher:John Wiley & Sons Inc
 Probability and Statistics for Engineering and th...StatisticsISBN:9781305251809Author:Jay L. DevorePublisher:Cengage Learning
 Statistics for The Behavioral Sciences (MindTap C...StatisticsISBN:9781305504912Author:Frederick J Gravetter, Larry B. WallnauPublisher:Cengage Learning
 Elementary Statistics: Picturing the World (7th E...StatisticsISBN:9780134683416Author:Ron Larson, Betsy FarberPublisher:PEARSON
 The Basic Practice of StatisticsStatisticsISBN:9781319042578Author:David S. Moore, William I. Notz, Michael A. FlignerPublisher:W. H. Freeman
 Introduction to the Practice of StatisticsStatisticsISBN:9781319013387Author:David S. Moore, George P. McCabe, Bruce A. CraigPublisher:W. H. Freeman