
Concept explainers
Videos
(a)
To construct a histogram of the probability distribution and how this is different from the one in example.
(a)
Explanation of Solution
We note that from Galton’s board:
Evaluate at
The histogram is as:
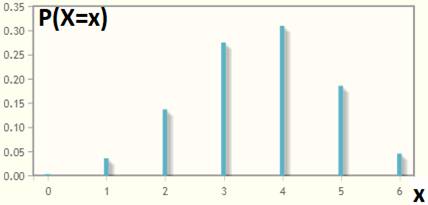
We note that this distribution is skewed to the left while the graph in the example was symmetric.
(b)
To calculate how many ball would you expect to land Slot D and explain.
(b)
Answer to Problem 8.66E
Explanation of Solution
The ball ends up in Slot D, if the ball moved to the right of the peg three times and the ball moved to the left of the peg three times.
Evaluate at
Chapter 8 Solutions
Statistics Through Applications
Additional Math Textbook Solutions
Statistical Reasoning for Everyday Life (5th Edition)
Introductory Statistics
Statistics for Psychology
Elementary Statistics Using Excel (6th Edition)
Elementary Statistics: Picturing the World (7th Edition)
Statistics: The Art and Science of Learning from Data (4th Edition)


 MATLAB: An Introduction with ApplicationsStatisticsISBN:9781119256830Author:Amos GilatPublisher:John Wiley & Sons Inc
 Probability and Statistics for Engineering and th...StatisticsISBN:9781305251809Author:Jay L. DevorePublisher:Cengage Learning
 Statistics for The Behavioral Sciences (MindTap C...StatisticsISBN:9781305504912Author:Frederick J Gravetter, Larry B. WallnauPublisher:Cengage Learning
 Elementary Statistics: Picturing the World (7th E...StatisticsISBN:9780134683416Author:Ron Larson, Betsy FarberPublisher:PEARSON
 The Basic Practice of StatisticsStatisticsISBN:9781319042578Author:David S. Moore, William I. Notz, Michael A. FlignerPublisher:W. H. Freeman
 Introduction to the Practice of StatisticsStatisticsISBN:9781319013387Author:David S. Moore, George P. McCabe, Bruce A. CraigPublisher:W. H. Freeman