
Concept explainers
Videos
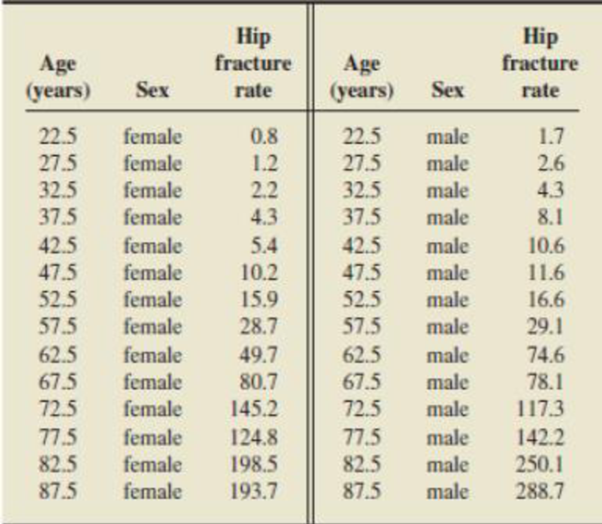
Hip Fracture Rates. Refer to Exercise B.25 on page B-25, regarding the results of a study on the rates of hip fracture for women and men in Beijing, China. In that exercise, we considered the relationship between hip fracture rate and age for women only. We now add the hip fracture rate for men to the study and consider the relationship between frac (hip fracture rate) and the predictor variable age and indicator variable sex, where
Here are the data.
In Exorcise B.25 we considered transformations to straighten the
- a. Obtain the scatterplot of ln(frac) versus age, using a different plot symbol for each sex. Based on this plot does it appear that sex is a useful predictor variable? Explain your answer.
- b. Obtain the
regression analysis of ln(frac) on age and sex. Conduct t-tests for the individual utility of the two predictor variables at the 5% level of significance. Interpret your results. - c. Based on the output in part (b), obtain the individual regression equations relating frac to age for females and for males.
- d. Obtain plots of residuals versus fitted values, residuals versus age, and residuals versus sex, and a normal probability plot of the residuals. Perform a residual analysis to assess the appropriateness of the regression equation, constancy of the conditional standard deviations, and normality of the conditional distributions. Check for outliers and influential observations.
- e. Provide a scatterplot of frac versus age with the regression curves for each sex. Based on this plot and your residual analysis in part (d), do you feel that this model fits the data well? Explain your answer.
- f. To check for possible interaction between the two predictor variables, perform the regression analysis of ln(frac) on age, sex, and sex·age. Is there an interaction between age and sex? Use α = 0.05.
Want to see the full answer?
Check out a sample textbook solution
Chapter B Solutions
Introductory Statistics, Books a la Carte Plus NEW MyLab Statistics with Pearson eText -- Access Card Package (10th Edition)


- What does the y -intercept on the graph of a logistic equation correspond to for a population modeled by that equation?arrow_forwardRespiratory Rate Researchers have found that the 95 th percentile the value at which 95% of the data are at or below for respiratory rates in breath per minute during the first 3 years of infancy are given by y=101.82411-0.0125995x+0.00013401x2 for awake infants and y=101.72858-0.0139928x+0.00017646x2 for sleeping infants, where x is the age in months. Source: Pediatrics. a. What is the domain for each function? b. For each respiratory rate, is the rate decreasing or increasing over the first 3 years of life? Hint: Is the graph of the quadratic in the exponent opening upward or downward? Where is the vertex? c. Verify your answer to part b using a graphing calculator. d. For a 1- year-old infant in the 95 th percentile, how much higher is the walking respiratory rate then the sleeping respiratory rate? e. f.arrow_forwardFind the equation of the regression line for the following data set. x 1 2 3 y 0 3 4arrow_forward
 Calculus For The Life SciencesCalculusISBN:9780321964038Author:GREENWELL, Raymond N., RITCHEY, Nathan P., Lial, Margaret L.Publisher:Pearson Addison Wesley,
 Glencoe Algebra 1, Student Edition, 9780079039897...AlgebraISBN:9780079039897Author:CarterPublisher:McGraw Hill
 Functions and Change: A Modeling Approach to Coll...AlgebraISBN:9781337111348Author:Bruce Crauder, Benny Evans, Alan NoellPublisher:Cengage Learning
 Big Ideas Math A Bridge To Success Algebra 1: Stu...AlgebraISBN:9781680331141Author:HOUGHTON MIFFLIN HARCOURTPublisher:Houghton Mifflin Harcourt