
Concept explainers
Videos
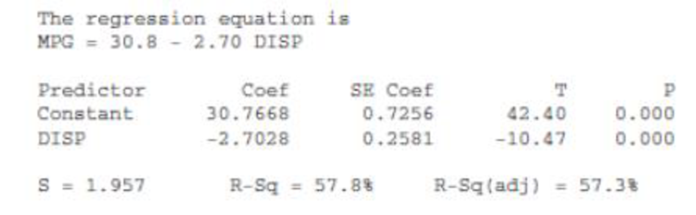
Gasoline Mileage Ratings. Refer to Exercise B.84 on page B-113, where we considered the regression of gasoline mileage (mpg) on displacement (disp), horsepower (hp), and weight (weight) for 82 vehicles classified as cars. Use Output B.69 on pages B-114–B-116 to do the following.
- a. Use the maximum-R2 criterion to obtain a regression equation for these data.
- b. Use the adjusted-R2 criterion to obtain a regression equation for these data.
- c. Use the Mallows’ Cp criterion to obtain a regression equation for these data.
- d. Do the three methods used in parts (a), (b), and (c) yield the same final regression equation? If so, is that always the case?
OUTPUT B.69 Output for Exercises B.84, B.98, and B.115
Predictor variable is disp
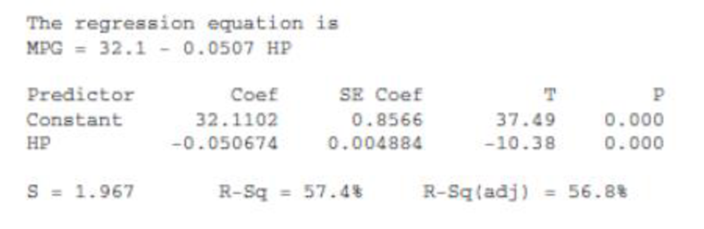
Predictor variable is hp
OUTPUT B.69 (cont.) Output for Exercises B.84, B.98, and B. 115
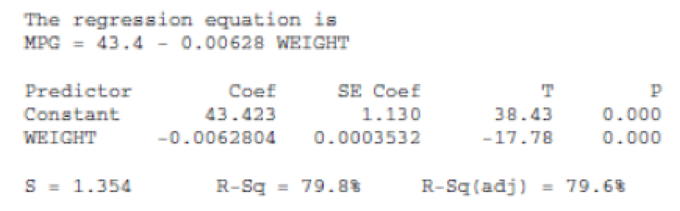
Predictor variable is weight
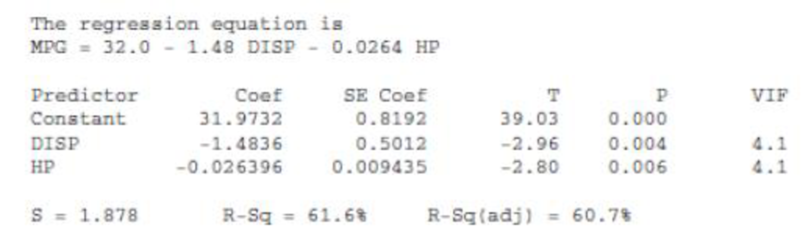
Predictor variables are disp and hp
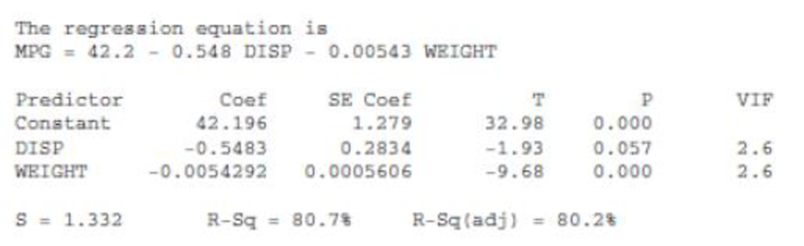
Predictor variables are disp and weight
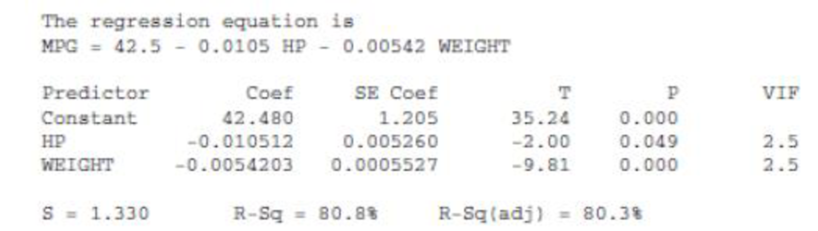
Predictor variables are hp and weight
OUTPUT B.69 (cont.) Output for Exercises B.84, B.98, and B. 115
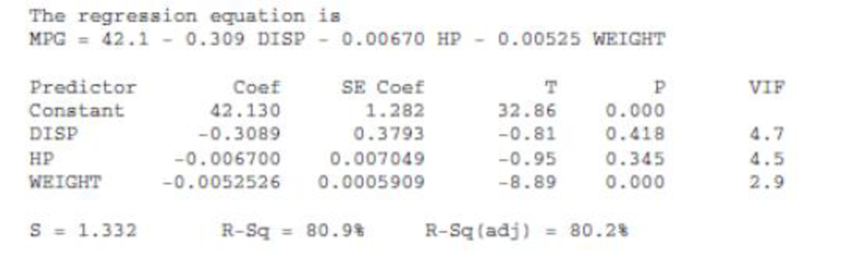
Predictor variables are disp, hp, and weight
Want to see the full answer?
Check out a sample textbook solution
Chapter B Solutions
Introductory Statistics, Books a la Carte Plus NEW MyLab Statistics with Pearson eText -- Access Card Package (10th Edition)


- Sam Jones has 2 years of historical sales data for his company. He is applyingfor a business loan and must supply his projections of sales by month for thenext 2 years to the bank. a. Using the data from Table 6–12, provide a regression forecast for timeperiods 25 through 48.b. Does Sam’s sales data show a seasonal pattern?arrow_forwardThe table gives the average heights of children for ages 1 – 10, where x = the age (in years) and y = the height (in cm). Part a: Make a scatter plot and determine which type of model best fits the data.Part b: Find the regression equation.Part c: Can your equation be used to find the average height of a 20 year old? Explain.arrow_forwardPart I. Run two regressions in Excel using the provided Excel file “Layoffs”.The Excel file Layoffs provides data on 50 manufacturing workers who lost their jobs due to layoffs. The data includes the following list of variables:Weeks – the number of weeks a manufacturing worker has been without a jobAge – the age of the workerEducation – the number of years of education of the workerMarried – a dummy variable, equal to 1 if the worker is married, 0 otherwiseHead – a dummy variable, equal to 1 if the worker is a head of household, 0 otherwiseTenure – the number of years on the previous jobManager – a dummy variable, equal to 1 if the worker had a management occupation, 0 otherwise Sales – a dummy variable, equal to 1 if the worker had an occupation in sales, 0 otherwise 1. Run a simple regression with a dependent variable Weeks and an independent variable Age. Create the regular and standardized residual plots for the simple regression. 2. Run a multiple regression with a dependent…arrow_forward
- I have no idea how to fill in the blank in this regression output... please helparrow_forwardWhich equation best represents the regression line for the data given in the table above? Oy=-3x+ 22 Oy=-3x-22 Oy= 3x+ 22 Oy= 3x- 22 71 hp Oly insertarrow_forwardThe following is the recorded earthquakes on South Carolina from August, 2016 to February, 2017. Use the data to find the residuals. Then draw a residual plot by hand. Use the residual plot to determine if the linear model is the best regression model for this data.arrow_forward
- Q2) Convert the data in table below into information using regression approach. X 1 2 3 4 5 6 Y 6 1 9 5 17 12arrow_forwarda. Write out the estimated linear regression equation. b. What is the estimated expected weight of an alligator that has snout Length=36 inches?arrow_forwardHot Dogs: The Caloric & Sodium (mg) Content of ten beef hot dogs are presented in Table 1. Determine the following for these data: Construct a scatter plot of these data in the space provided. Determine the regression equation for these data (r = .906; p< .01) Determine the estimated sodium content for a beef hot dog containing 112 caloriearrow_forward
- 3. Create two new independent variables: Top 2–5 and Top 6–10. Top 2–5 represents the number of times the driver finished between second and fifth place and Top 6–10 represents the number of times the driver finished between sixth and tenth place. Develop an estimated regression equation that can be used to predict Winnings ($) using Poles, Wins, Top 2–5, and Top 6–10. Test for individual significance and discuss your findings and conclusions. Driver Points Poles Wins Top 5 Top 10 Winnings ($) Tony Stewart 2403 1 5 9 19 6,529,870 Carl Edwards 2403 3 1 19 26 8,485,990 Kevin Harvick 2345 0 4 9 19 6,197,140 Matt Kenseth 2330 3 3 12 20 6,183,580 Brad Keselowski 2319 1 3 10 14 5,087,740 Jimmie Johnson 2304 0 2 14 21 6,296,360 Dale Earnhardt Jr. 2290 1 0 4 12 4,163,690 Jeff Gordon 2287 1 3 13 18 5,912,830 Denny Hamlin 2284 0 1 5 14 5,401,190 Ryan Newman 2284 3 1 9 17 5,303,020 Kurt Busch 2262 3 2 8 16 5,936,470 Kyle Busch 2246 1 4 14 18 6,161,020 Clint Bowyer…arrow_forwardIf we performed a t-test, how many people would be in the study based on the regression model in photo.arrow_forwardFind the fitted regression line for these data.arrow_forward
 Calculus For The Life SciencesCalculusISBN:9780321964038Author:GREENWELL, Raymond N., RITCHEY, Nathan P., Lial, Margaret L.Publisher:Pearson Addison Wesley,
 Functions and Change: A Modeling Approach to Coll...AlgebraISBN:9781337111348Author:Bruce Crauder, Benny Evans, Alan NoellPublisher:Cengage Learning