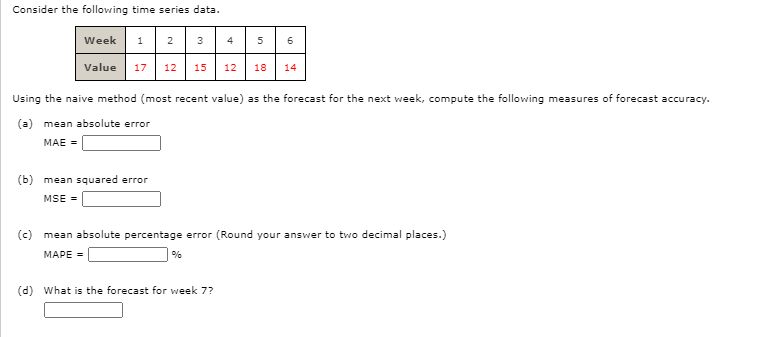
Consider the following time series data. Week 1 2 3 4 5 6 Value 17 12 15 12 18 14
Q: 7. The following time series represents sales of imported cars in a city for the years 2011 through…
A: Given data and calculation is shown below Year x Sales(y) 2011 1 524 2012 2 549 2013 3 910…
Q: 4. Compute four-period moving average and forecasting errors for the following time series: Period…
A: Given time series data:
Q: Consider the following time series data. Week 1 2 34 Value 19 11 16 10 17 12 5 6 (a) Construct a…
A: Introduction: The moving average method is to be used to find the forecast for Week 7, that is, t =…
Q: Hudson Marine provides boats sales, service, and maintenance. Boat trailers are one of its top sales…
A: Seasonal variations are those variations that tend to repeat themselves over a period of time…
Q: Assuming the trend to be absent determine the seasonal indices for the Following time series by the…
A:
Q: 11. Which type of data is displayed in the table below? obene year hprice proglas surf bdrms brems…
A: Hello Thankyou for the question. According to our honor code can answer one question at a time.…
Q: the values of alabama building contracts (in $ millions) for a 12-month period follow.240 350 230…
A: From the given data set the time series plot can be plotted by following the steps as written below:…
Q: Consider the following time series data: Year Value 1 234 2 287 255 3.
A: GIven, α = exponential smoothing coefficient Forecast, Ft = Ft-1 + α(At-1 - Ft-1) where, At =…
Q: Year 1915 1920 1925 1930 1935 1940 1945 1950 1955 Rate 3.1 2.2 5.3 7.5 8.5 7.4 10.3 22.1 17.6…
A: “Since you have asked multiple questions, we will solve the first question for you. If you want any…
Q: consider the following time series data.t 1 2 3 4 5 6 7yt10 9 7 8 6 4 4a. construct a time series…
A: a. From the given data set the time series plot can be plotted as follows: 1. Enter the data in…
Q: Consider the following time series. 1 3 4 5 7 10 10 14 16 (a) Choose the correct time series plot.…
A: Excel Procedure: Enter t and yt in Excel>Data>Data Analysis> ‘Regression’>Select yt…
Q: Consider the following time series data. Month 1 2 3 4 5 6 Value 26 15 22 14 21 25 17
A: Note: As per BNED guidelines, we are answering first three subparts. If any doubt, kindly resubmit…
Q: Consider the following time series data. Week 1 2 Value 18 12 3 4 5 16 12 16 Using the naive method…
A: Mean Absolute Percentage Error: It is the percentage value of the accuracy of the forecasted values.…
Q: The following information looks at computer ownership by year. 1985 8.2 (percentage of…
A: Enter the data in Excel.
Q: Consider the following 29 years worth of observed annual rainfall data (in inches) for a certain…
A: Time- series line graph:
Q: Consider the following time series data. Quarter Year 1 Year 2 Year 3 4 6. 3 5 7 3 6. a. Choose the…
A: (1) 2. Pattern exists in the data Horizontal Pattern With Seasonality. As graph is moving upward…
Q: Which components of time series data are evident in the graph shown below? 500- 400 - 300- 200 -…
A: The graph shown is between the time in year and the production of cars and shows a up and down…
Q: The values of Bahria building contracts (in Rupees millions) for a 12-month period follow. 240 350…
A: Given that following data first we plot
Q: Describe the following time-series patterns: a. Horizontal Pattern b. Trend Pattern c. Seasonal…
A: the following time-series patterns:
Q: Consider the following time series: Quarter Year 1 Year 2 Year 3 80 74 65 69 61 51 48 50 43 68 71 82…
A: a. The time-series plot is obtained using Excel as; 1. Enter the data into spreadsheet. 2. Go to…
Q: 12 The following table gives the population of a town during the last 5 Estimate the popularion for…
A:
Q: For the hawkins company, the monthly percentages of all shipments received on timeover the past 12…
A:
Q: Consider the following time series data. Week 12 3 4 6 Value 16 12 14 11| 15 13 (a) Construct a time…
A: (a) The time series plot is obtained using EXCEL. The software procedure is given below: Enter the…
Q: The numbers of worldwide airline fatalities are given below. Use a time series chart to display the…
A: Time series chart for the given data year fatalities 1988 699 1989 817 1990 440 1991 510…
Q: Consider the following time series data. Quarter Year 1 Year 2 Year 3 1 6 7 2 3 6 4 5 7 8 (a) Choose…
A: Hello! As you have posted more than 3 sub parts, we are answering the first 3 sub-parts. In case…
Q: QUESTION ONE The following is a Time Series for sales collected over a four year t for a company in…
A: 1st quarter 2nd Quarter 3rd quarter 4th quarter 2018 92 91 95 94 2019 99 100 98 96 2020 108…
Q: Consider the following time series data. Month 1 2 3 4 Value 25 12 19 13 18 24 16 (a) Compute MSE…
A: calculate the forecast error compute the mean squared error
Q: The folloiwing table shows data for U.S. movie theater admissions (per week). Display the data as a…
A:
Q: еВook Consider the following time series data: Month 1 2 3 4 5 7 Value 24 15 21 13 19 21 16
A: b) 3 month moving average : for 3 month moving average : MSE = 70/4 = 17.5 Forecast for month 8…
Q: #1Consider the following time series data.Week 1 2 3 4…
A: a) Forecast for week 7 can be calculated as:
Q: Consider the following time series data. Week 1 2 3 45 6 Value 18 11 13 10 17 12 (a) Construct a…
A: Given information: Week Value 1 18 2 11 3 13 4 10 5 17 6 12 Note: As per…
Q: b. Compute a five-quarter simple moving average forecast for quarters 6 through 13 and compute the…
A:
Q: Because of high tuition costs at state and private universities, enrollments at community colleges…
A: For the given data Find ( b ) b0 = ? b1 =? ( c ) forecast year 10
Q: 4. Compute four-period moving average and forecasting errors for the following time series: Period…
A: Four period moving average: The four period moving average values are calculated as follows: Here,…
Q: Consider the following time series data. Month 1 2 3 4 5 6 7 Value 22 11 18 10 17 21 13 (a) Compute…
A: The following solution is given below:
Q: Consider the following time series data. Week 1 2 3 4 6. Value 16 14 16 11 17 14 (a) Choose the…
A: Given data according to weeks We have to calculate forcast by moving average method and exponential…
Q: The geyser Old Faithful in Yellowstone National Park alternates periods of eruption, which typically…
A: Solution-: Given: Class width =5 and use 55 as the lower class limit for the first class We want to…
Q: The number of tourists who visit a coastal town is shown in the graph below. Number of tourists 16…
A: The given time series data for the visited number of tourists is:
Q: Consider the following time series data. Week 1 2 3456 Value 19 11 16 10 17 12 (a) Construct a time…
A: a) option (A) is correct The data appear to follow a horizontal pattern.
Q: Time-Series Value Month Forecast 1 110 2 130 3 120 4 110
A: The exponential smoothing forecast can be obtained by using the formula- Ft+1=αYt+1-αFt Using α=0.2,…
Q: . Compute all possible forecasts using a five-period moving average. (Rour
A: (b). Obtain the 5-period moving averages for the given data: Given data represents the values of…
Q: Series A 300 250 200 150 100 50 1 2 3 4 5 6 7 8 9 10 11 12 13 Which forecasting method would be most…
A: We know that there are various forecasting models in time series that can be used for forecasting…
Q: Which of the following is the most appropriate type of chart for determining the number of…
A:
Q: 3. Compute three-period moving average and forecasting errors for the following time series: Period…
A: Given, Period (t): 1 2 3 4 5 6 7 8 9 Value (Xt): 15 27 20 14 25 11 20 25 18
Q: Refer to the gasoline sales time series data in the given table. Week Sales (1000s of gallons) 1…
A: The moving average is calculated by adding all the observation over a period of time is divided by…
Q: The data below represent the life of 40 similar car batteries recorded top the nearest tenth of a…
A:
Q: 43.30 53.02 63.52 45.93 48.26 50.51 49.57 43.93 46.77 59.12 54.49 47.38 40.78 45.05 50.37 54.91…
A: The given data is , Year annual rainfall ( inches ) 1 43.3 2 53.02 3 63.52 4 45.93 5…
Q: Question 2: Find the trend for the time series using moving average method. Forecast for Year 4…
A: using moving average method :
Q: Week 1 2 3 4 5 6 Value 18 13 16 11 17 14 Using the naive method (most recent value) as the…
A: Here, the forecast value is the previous week time series value.
q1 hw
Step by step
Solved in 2 steps with 11 images
- Consider the following time series data: Using the naïve method (most recent value) as the forecast for the next week, compute thefollowing measures of forecast accuracy:a. Mean absolute errorb. Mean squared errorc. Mean absolute percentage errord. What is the forecast for week 7?From the table below, find Prof. Robot expected value lateness. X= lateness P (Lateness) on time 4/5 1hr late 1/10 2hrs late 1/20 3hrs late 1/20Suppose that ants are exiting a mound according to a Poisson process with a mean rate of 12 ants per minute. If a point in time is selected, what is the probability that more than 3 seconds will elapse from that time before the next ant exits the mound? What is the mean time (in seconds) until the next ant exits? Round your answers to four decimal places, if necessary. P(T > 8) = μ T =
- Consider the following time series data. a. Show the four-quarter and centered moving average values for this time series (to 3 decimals if necessary). b. Compute seasonal indexes and adjusted seasonal indexes for the four quarters (to 3 decimals).In the article “The World's Longest Continued Series of Sea Level Observations” (M. Ekman, Paleogeography, 1988:73–77), the mean annual level of land uplift in Stockholm, Sweden, was estimated to be 4.93 ± 0.23 mm for the years 1774–1884 and to be 3.92 ± 0.19 mm for the years 1885–1984. Estimate the difference in the mean annual uplift between these two time periods, and find the uncertainty in the estimate.A lumber company is making boards that are 2840.0 millimeters tall. If the boards are too long they must be trimmed, and if they are too short they cannot be used. A sample of 39 boards is made, and it is found that they have a mean of 2838.2 millimeters. Assume the standard deviation is known to be 10.0. Is there evidence at the 0.02level that the boards are too short and unusable? Step 1 of 5 : Enter the hypotheses:
- Q4 A sample of 37 wealth-market mutual funds was chosen on February 1, 2016, and the average annual rate of return over the past 30 days was found to be 3.28 percent, and the sample standard deviation was 0.515 percent. A year earlier, a sample of 43 wealth-market funds showed an average rate of return of 4.41 percent, and the sample standard deviation was 0.89 percent. Is it reasonable to conclude (at α=0.01) that wealth-market interest rates declined during 2015?Consider the following time series data: Week Value 18 13 16 11 17 14 Using the naïve method (most recent value) as the forecast for the next week, compute the following measures of forecast accuracy. a. Mean Absolute Error b. Mean Squared Error c. Mean Absolute Percentage Error d. What is the forecast for Week 7?Consider a tower that has leaned an inclination of 18o. The tower continues to lean at annual increment A, which is normally distributed with a mean value of 0.1o and a c.o.v of 30%. Assume that the incremental amounts of additional leaning between years are statistically independent. Determine the probability that the final inclination of the tower after 16 years will exceed 20o.
- Suppose that the life expectancy of a certain brand of nondefective light bulbs is normally distributed, with a mean life of 1300 hr and a standard deviation of 50 hr. If 30,000 of these bulbs are produced, how many can be expected to last at least 1300 hr? The number of light bulbs that can be expected to last at least 1300 hr is _____? z 0.00 0.01 0.02 0.03 0.04 0.05 0.06 0.07 0.08 0.09 0.0 0.1 0.2 0.3 0.4 0.5000 0.5398 0.5793 0.6179 0.6554 0.5040 0.5438 0.5832 0.6217 0.6591 0.5080 0.5478 0.5871 0.6255 0.6628 0.5120 0.5517 0.5910 0.6293 0.6664 0.5160 0.5557 0.5948 0.6331 0.6700 0.5199 0.5596 0.5987 0.6368 0.6736 0.5239 0.5636 0.6026 0.6406 0.6772 0.5279 0.5675 0.6064 0.6443 0.6808 0.5319 0.5714 0.6103 0.6480 0.6844 0.5359 0.5753 0.6141 0.6517 0.6879 0.5 0.6 0.7 0.8 0.9 0.6915 0.7257 0.7580 0.7881 0.8159 0.6950 0.7291 0.7611 0.7910 0.8186 0.6985 0.7324 0.7642 0.7939 0.8212 0.7019 0.7357 0.7673 0.7967 0.8238 0.7054 0.7389 0.7704 0.7995…Suppose the daily demand for petrol at a certain petrol station is nomally distributed with a mean of 6849 litres and a standard deviation of 342 litres. This morning the manager notices that there is 7105.5 litres in storage with the next delivery coming only at closing. a) What is the probability that there will be enough petrol to meet the daily demand? (Rounded to 4 decimal places)Answer b) If a year has 365 days, how many days do you expect the demand to be less than 7105.5 litres? (Rounded to the nearest integer)1. Find the pooled estimate of the standard deviation if n1 = 11, n2 = 13, S2= 1.6, and S1= 1.2 (Write 3 decimal places)