For the following data, which represent the compressive tolerance of a particular material, find the following: 1- range 2- Draw the recurring polygon. 3- Draw the histogram. 300 400 500 600 700 800 900 1000 1100 Category 399 499 599 699 799 899 999 1099 1199 Repetition 14 46 58 76 68 62 49 22
For the following data, which represent the compressive tolerance of a particular material, find the following: 1- range 2- Draw the recurring polygon. 3- Draw the histogram. 300 400 500 600 700 800 900 1000 1100 Category 399 499 599 699 799 899 999 1099 1199 Repetition 14 46 58 76 68 62 49 22

MATLAB: An Introduction with Applications
6th Edition
ISBN:9781119256830
Author:Amos Gilat
Publisher:Amos Gilat
Chapter1: Starting With Matlab
Section: Chapter Questions
Problem 1P

Related questions
Question
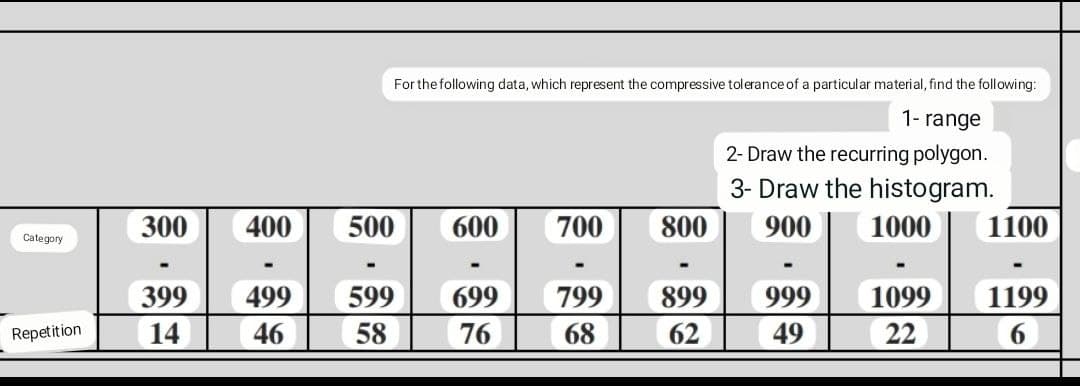
Transcribed Image Text:For the following data, which represent the compressive tolerance of a particular material, find the following:
1- range
2- Draw the recurring polygon.
3- Draw the histogram.
300
400
500
600
700
800
900
1000
1100
Category
399
499
599
699
799
899
999
1099
1199
Repetition
14
46
58
76
68
62
49
22
6.
Expert Solution
This question has been solved!
Explore an expertly crafted, step-by-step solution for a thorough understanding of key concepts.

Step by step
Solved in 2 steps with 2 images

Recommended textbooks for you
MATLAB: An Introduction with Applications
Statistics
ISBN:
9781119256830
Author:
Amos Gilat
Publisher:
John Wiley & Sons Inc

Probability and Statistics for Engineering and th…
Statistics
ISBN:
9781305251809
Author:
Jay L. Devore
Publisher:
Cengage Learning

Statistics for The Behavioral Sciences (MindTap C…
Statistics
ISBN:
9781305504912
Author:
Frederick J Gravetter, Larry B. Wallnau
Publisher:
Cengage Learning
MATLAB: An Introduction with Applications
Statistics
ISBN:
9781119256830
Author:
Amos Gilat
Publisher:
John Wiley & Sons Inc
Probability and Statistics for Engineering and th…
Statistics
ISBN:
9781305251809
Author:
Jay L. Devore
Publisher:
Cengage Learning
Statistics for The Behavioral Sciences (MindTap C…
Statistics
ISBN:
9781305504912
Author:
Frederick J Gravetter, Larry B. Wallnau
Publisher:
Cengage Learning

Elementary Statistics: Picturing the World (7th E…
Statistics
ISBN:
9780134683416
Author:
Ron Larson, Betsy Farber
Publisher:
PEARSON

The Basic Practice of Statistics
Statistics
ISBN:
9781319042578
Author:
David S. Moore, William I. Notz, Michael A. Fligner
Publisher:
W. H. Freeman

Introduction to the Practice of Statistics
Statistics
ISBN:
9781319013387
Author:
David S. Moore, George P. McCabe, Bruce A. Craig
Publisher:
W. H. Freeman