Please show all work. 1. estimate the position of the equivalance point 2. estimate the position of the half-equivalance point 3. calculate the percent error in the experimental pKa value (accepted pKa value is 4.75) 4. Identify the buffering region 5. Identify the volme ranges that corresponed to the initial color and the final color of the indicator
Please show all work. 1. estimate the position of the equivalance point 2. estimate the position of the half-equivalance point 3. calculate the percent error in the experimental pKa value (accepted pKa value is 4.75) 4. Identify the buffering region 5. Identify the volme ranges that corresponed to the initial color and the final color of the indicator

Chapter10: Potentiometry And Redox Titrations
Section: Chapter Questions
Problem 10P

Related questions
Question
Please show all work.
1. estimate the position of the equivalance point
2. estimate the position of the half-equivalance point
3. calculate the percent error in the experimental pKa value (accepted pKa value is 4.75)
4. Identify the buffering region
5. Identify the volme ranges that corresponed to the initial color and the final color of the indicator
| Volume | pH |
| 0 | 2.88 |
| 0.05 | 2.9 |
| 0.14 | 2.95 |
| 0.55 | 3.14 |
| 1.15 | 3.35 |
| 1.45 | 3.44 |
| 1.97 | 3.56 |
| 2.36 | 3.63 |
| 2.77 | 3.69 |
| 3.17 | 3.75 |
| 3.78 | 3.84 |
| 4.09 | 3.86 |
| 4.59 | 3.92 |
| 5 | 3.98 |
| 5.39 | 4 |
| 5.8 | 4.03 |
| 6.3 | 4.09 |
| 6.6 | 4.11 |
| 6.99 | 4.13 |
| 7.5 | 4.17 |
| 8.01 | 4.22 |
| 8.31 | 4.23 |
| 8.8 | 4.27 |
| 9.2 | 4.3 |
| 9.5 | 4.3 |
| 9.91 | 4.34 |
| 10.53 | 4.37 |
| 10.92 | 4.4 |
| 11.33 | 4.41 |
| 11.63 | 4.44 |
| 12.14 | 4.47 |
| 12.53 | 4.47 |
| 12.94 | 4.51 |
| 13.35 | 4.52 |
| 13.74 | 4.56 |
| 14.14 | 4.56 |
| 14.54 | 4.59 |
| 15.04 | 4.62 |
| 15.33 | 4.64 |
| 15.73 | 4.65 |
| 16.22 | 4.67 |
| 16.62 | 4.71 |
| 17.02 | 4.72 |
| 17.33 | 4.73 |
| 17.73 | 4.75 |
| 18.34 | 4.79 |
| 18.63 | 4.8 |
| 19.02 | 4.82 |
| 19.43 | 4.84 |
| 19.92 | 4.88 |
| 20.33 | 4.9 |
| 20.73 | 4.92 |
| 21.14 | 4.94 |
| 21.64 | 4.98 |
| 22.04 | 5 |
| 22.44 | 5.01 |
| 22.93 | 5.05 |
| 23.44 | 5.08 |
| 23.83 | 5.12 |
| 24.23 | 5.13 |
| 24.54 | 5.15 |
| 25.05 | 5.18 |
| 25.45 | 5.22 |
| 25.94 | 5.25 |
| 26.34 | 5.29 |
| 26.85 | 5.35 |
| 27.24 | 5.37 |
| 27.66 | 5.41 |
| 28.17 | 5.47 |
| 28.58 | 5.5 |
| 29.08 | 5.57 |
| 29.58 | 5.64 |
| 29.88 | 5.69 |
| 30.28 | 5.77 |
| 30.79 | 5.88 |
| 31.18 | 5.97 |
| 31.58 | 6.12 |
| 32.08 | 6.38 |
| 32.38 | 6.67 |
| 32.79 | 10.07 |
| 33.29 | 10.89 |
| 33.69 | 11.1 |
| 34.09 | 11.24 |
| 34.48 | 11.36 |
| 34.88 | 11.44 |
| 35.38 | 11.52 |
| 35.78 | 11.58 |
| 36.18 | 11.63 |
| 36.58 | 11.68 |
| 36.98 | 11.71 |
| 37.39 | 11.76 |
| 37.89 | 11.8 |
| 38.2 | 11.82 |
| 38.7 | 11.85 |
| 39.09 | 11.89 |
| 39.59 | 11.9 |
| 39.98 | 11.93 |
| 40.38 | 11.95 |
| 40.88 | 11.98 |
| 41.18 | 11.98 |
| 41.57 | 12.01 |
| 42.06 | 12.02 |
| 42.47 | 12.05 |
| 42.97 | 12.06 |
| 43.37 | 12.08 |
| 43.77 | 12.09 |
| 44.17 | 12.1 |
| 44.67 | 12.12 |
| 45.06 | 12.12 |
| 45.37 | 12.14 |
| 45.76 | 12.16 |
| 46.17 | 12.16 |
| 46.67 | 12.18 |
| 47.05 | 12.19 |
| 47.55 | 12.2 |
| 47.95 | 12.21 |
| 48.35 | 12.22 |
| 48.65 | 12.22 |
| 49.05 | 12.23 |
| 49.55 | 12.23 |
| 49.85 | 12.25 |
| 50 | 12.24 |
the first picture is the example
2nd picture is the graph from the data need to be filled in
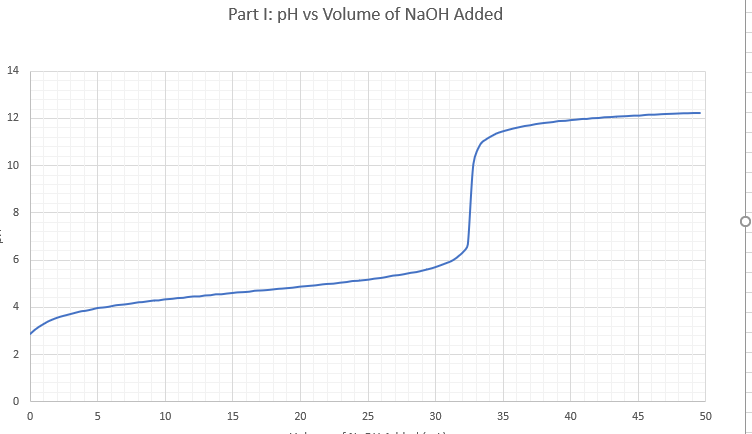
Transcribed Image Text:Part I: pH vs Volume of NaOH Added
14
12
10
8
6
4
10
15
20
25
30
35
40
45
50
2.
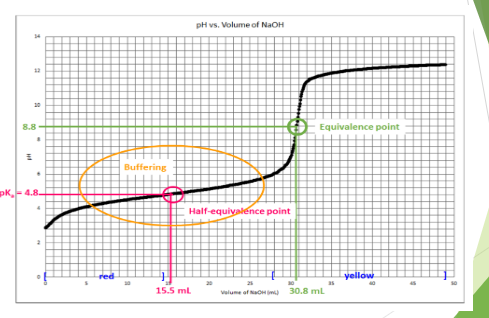
Transcribed Image Text:pH vs. Volume of NaOH
14
10
8.8-
Equivalence point
Buffering
pK.-4.8-
Half-equiyalence point
red
vellow
25
as
15.5 ml
Velume of NaOH
30.8 ml
Expert Solution
This question has been solved!
Explore an expertly crafted, step-by-step solution for a thorough understanding of key concepts.

Step by step
Solved in 5 steps with 2 images

Knowledge Booster


Learn more about
Need a deep-dive on the concept behind this application? Look no further. Learn more about this topic, chemistry and related others by exploring similar questions and additional content below.Recommended textbooks for you