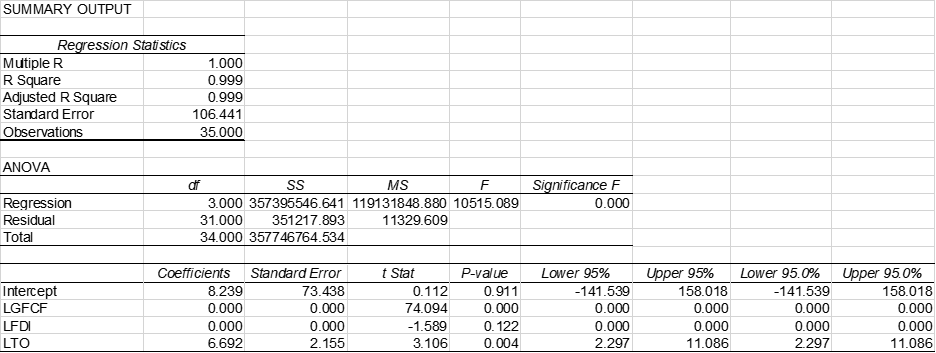
SUMMARY OUTPUT Regression Stati stics Mutiple R R Square Adjusted R Square Standard Error 1.000 0.999 0.999 106.441 Observations 35.000 ANOVA df SS MS F Significance F Regression 3.000 357395546.641 119131848.880 10515.089 0.000 Residual 31.000 351217.893 11329.609 Total 34.000 357746764.534 t Stat Upper 95% 158.018 0.000 Coefficients Standard Error P-value Lower 95% Lower 95.0% Upper 95.0% Intercept 8.239 73.438 0.112 0.911 -141.539 -141.539 158.018 LGFCF 0.000 0.000 74.094 0.000 0.000 0.000 0.000 0. 122 0.004 LFDI 0.000 0.000 -1.589 0.000 0.000 0.000 0.000 LTO 6.692 2.155 3.106 2.297 11.086 2.297 11.086
SUMMARY OUTPUT Regression Stati stics Mutiple R R Square Adjusted R Square Standard Error 1.000 0.999 0.999 106.441 Observations 35.000 ANOVA df SS MS F Significance F Regression 3.000 357395546.641 119131848.880 10515.089 0.000 Residual 31.000 351217.893 11329.609 Total 34.000 357746764.534 t Stat Upper 95% 158.018 0.000 Coefficients Standard Error P-value Lower 95% Lower 95.0% Upper 95.0% Intercept 8.239 73.438 0.112 0.911 -141.539 -141.539 158.018 LGFCF 0.000 0.000 74.094 0.000 0.000 0.000 0.000 0. 122 0.004 LFDI 0.000 0.000 -1.589 0.000 0.000 0.000 0.000 LTO 6.692 2.155 3.106 2.297 11.086 2.297 11.086
Functions and Change: A Modeling Approach to College Algebra (MindTap Course List)
6th Edition
ISBN:9781337111348
Author:Bruce Crauder, Benny Evans, Alan Noell
Publisher:Bruce Crauder, Benny Evans, Alan Noell
Chapter5: A Survey Of Other Common Functions
Section5.6: Higher-degree Polynomials And Rational Functions
Problem 5E: Population Genetics In the study of population genetics, an important measure of inbreeding is the...
Related questions
Question
Let us try to find out what is the relation between the CO2C emissions per capita between the GDP, gross fixed capital formation(GFCF), trade openness(trade openness), foreign direct investment (FDI).

Transcribed Image Text:SUMMARY OUTPUT
Regression Stati stics
Mutiple R
R Square
Adjusted R Square
Standard Error
1.000
0.999
0.999
106.441
Observations
35.000
ANOVA
df
SS
MS
F
Significance F
Regression
3.000 357395546.641 119131848.880 10515.089
0.000
Residual
31.000
351217.893
11329.609
Total
34.000 357746764.534
t Stat
Upper 95%
158.018
0.000
Coefficients
Standard Error
P-value
Lower 95%
Lower 95.0%
Upper 95.0%
Intercept
8.239
73.438
0.112
0.911
-141.539
-141.539
158.018
LGFCF
0.000
0.000
74.094
0.000
0.000
0.000
0.000
0. 122
0.004
LFDI
0.000
0.000
-1.589
0.000
0.000
0.000
0.000
LTO
6.692
2.155
3.106
2.297
11.086
2.297
11.086
Expert Solution
This question has been solved!
Explore an expertly crafted, step-by-step solution for a thorough understanding of key concepts.
This is a popular solution!
Trending now
This is a popular solution!
Step by step
Solved in 2 steps with 1 images

Recommended textbooks for you

Functions and Change: A Modeling Approach to Coll…
Algebra
ISBN:
9781337111348
Author:
Bruce Crauder, Benny Evans, Alan Noell
Publisher:
Cengage Learning

Functions and Change: A Modeling Approach to Coll…
Algebra
ISBN:
9781337111348
Author:
Bruce Crauder, Benny Evans, Alan Noell
Publisher:
Cengage Learning