SUMMARY OUTPUT Regression Statistics Multiple R R Square Adjusted R Sq Standard Error Observations 0.9027 0.8148 0.8016 148.1904 16 ANOVA F Signdicance F SS 1 1,352,635.29 1,352,635.29 14 307 445.65 df MS Regression Residual 61.59 0.00000171 21,960.40 Total 15 1,660,080.94 Lower 95% Coefficients Standard Eror 437.8799 16.9448 : Stat 5.3175 7.8482 Pvalue 0.0001 0.0000 Upper 95% Lower 95.0% Upper 95.0% 614.4981 21.5756 82.3477 261.2617 614.4981 261.2617 Intercept $TV ads 2.1591 12.3141 21.5756 12.3141
Q: Determine whether the intercept coefficient (1664.46) is statistically significant at the 5 percent…
A: Determine whether the intercept coefficient (1664.46) is statistically significant at the 5 percent…
Q: A regression model relating x, number of salespersons at a branch office, to y, annual sales at the…
A: The data shows the number of salespersons at a branch office and annual sales at the office.
Q: Cars.com would like to use simple linear regression to predict the selling price of a used car, in…
A: From the provided output the intercept of the model is 11.6881 and the slope is -0.5072.
Q: tudy the regression output that follows. How many predictors are there? What is the equation of the…
A: The coefficient table shows that the coefficient of x1 is equal to 0.01049. Similarly, the…
Q: Descriptive Statistics Dependent Variable: speed Std. Deviation sucroseamount Mean N 8% 3.0000…
A: Given Information:
Q: table1: Model Summary Model R. R Square Adjusted R Square Std. Error of the Estimate 1 .611° .374…
A: The simple linear regression is used to predict the dependent variable based on the independent…
Q: A regression model relating a, number of salespersons at a branch office, to y, annual sales at the…
A: Given that
Q: A regression model relating x, number of salespersons at a branch office, to y, annual sales at the…
A: Solution: The estimated regression equation is Annual sales^=75+40 Number of salespersons
Q: data show Systole diastolic biood pressure i certain people. Find th regression letting the Systolic…
A: Solution: Let x = Systolic reading and y= Diastolic reading x y (x-x) (x-x)2 (y-y) (y-y)2…
Q: Ql: Consider regression model Y,= B + B2X½+ B3X3, +U,with hypothetical data Evx, = 50, Eri = 20, =…
A: The confidence interval calculated using the values sample statistic or population parameter,…
Q: The following presents a sample of the number of defective flash drives produced by a small…
A: Here, from the Excel output, it is clear that week (y) is considered as dependent variable and…
Q: Regression Statistics Multiple R 0.87027387 R Square 0.75737661…
A: As due to the honor-code we are authorized to answer only 3 subparts for each question and that you…
Q: SUMMARY OUTPUT Regression Statistics Multiple R 0.960473 R Square 0.922509 Adjusted F 0.905288…
A: Introduction: The response or dependent variable, y is the number of computer sales, and the…
Q: SUMMARY OUTPUT X Line Fit Plot Regression Statistics Multiple R 0.92966968 10 R Square 0.864285714…
A: From the given information we want to find degrees of freedom.
Q: MULTIPLE REGRESSION EXCEL OUTPUT (PULL STRENGTH) SUMMARY OUTPUT Regression Statistics Multiple R…
A: Multiple linear regression: Suppose (xi1, xi2---xin, y1), (xi1, xi2---xin, y2)---(xi1, xi2---xin,…
Q: SUMMARY OUTPUT Regression Statistics Multiple R 0.999301299 R Square 0.998603086 Adjusted R…
A:
Q: UMMARY OUTPUT Regression Statistics Multiple R 0.4746 R square 0.2252 Adjusted R Square 0.2091…
A: Solution: n= 50 observation k= 1 independent variable Here we need to test the significance of…
Q: Anova score Cases Sum of Squares df mean square F p n2 Group 2492.333 2 1246.167 10.001 <.001 0.488…
A: “Since you have asked multiple questions, we will solve the first question for you. If you want any…
Q: SUMMARY OUTPUT Regression Statistics Multiple R R Square Adjusted R Square Standard Error 0.953…
A: Here the total number of observations = n = 20 Response variable : y : Teacher's salary Predictor…
Q: Regression Statistics Multiple R 0.9086 R square A Adjusted R square 0.8181 standard Error 398.0910…
A: The Multiple R or correlation coefficient is r = 0.9086.
Q: Allstate wants to study the relationship between the amount of fire damage and the distance between…
A: It is given that the ANOVA table and regression output of the data.
Q: Regression Analysis: y versus x1, X2, ×3, X4 Summary Output Regression Statistics R Square 0.802…
A:
Q: SUMMARY OUTPUT Regression Statistics Multiple R 0.954707 R Square 0.911465 Adjusted R Square…
A: 1. R squared is defined to be the percentage of variability of a dependent variable that has been…
Q: SUMMARY OUTPUT Regression Statistics Multiple R R Square Adjusted R Square 0.959 0.919 0.909…
A: The equation of the line is given by,
Q: SUMMARY OUTPUT Regression Statistics Multiple R 0.009746989 R Square 9.50038E-05 Adjusted R Square…
A: Compute the test statistic by substituting b1=-0.0067 and s.eb1=0.0692 from the output table in the…
Q: SUMMARY OUTPUT Regression Statistics Multiple R 0.962119939 RSquare 0.925674777 Adjusted RSquare…
A:
Q: Model Summary Adjusted R Square Std. Error of the Estimate Model R Square .772 .596 .516 215.1509 a.…
A:
Q: Descriptive Statistics Dependent Variable: speed Std. Deviation sucroseamount Mean N 8% 3.0000…
A: The given information is about the ANOVA table and the descriptive statistics.
Q: SUMMARY OUTPUT Regression Statistics Multiple R R-Square 0.971 A Adjusted R-Square B 30.462 Standard…
A: The t statistic 26.79 is and the standard error is 62.13.
Q: A regression model relating x, number of salespersons at a branch office, to y, annual sales at the…
A: we have given regression analysis output we have calculate F statistics,t statistics and also…
Q: Method p: event proportion Exact method is used for this analysis. Descriptive Statistics N…
A: “Since you have posted a question with multiple sub-parts, we will solve the first three subparts…
Q: Regression Statistics Multiple R R Square Adjusted R Square 0.707 Standard Error Observations ANOVA…
A: r2 is coefficient of determination, Here total observations, n= 8 k= 2 Given that, r2adjusted =…
Q: In regression (1), Y is regressed against X1. In regression (2), Y is regressed against X1,X2, X3,…
A: Given information: The values of coefficient of determination and sample sizes are given for 2…
Q: student used multiple regression analysis to study how family spending (y) is influenced by income…
A: d. The hypotheses are; H0: β3 = 0 Ha: β3 ≠ 0 The test statistic is,
Q: What is the marginal effect of education on salary? Is this marginal effect different for male and…
A: Given information : The Summary output for a particular data is given.
Q: SUMMARY OUTPUT Regression Statistics Multiple R R Square Adjusted R Square 0.959 0.919 0.909…
A:
Q: You want to know if cat owners or dog owners sleep longer. You recruit a group of cat owners and a…
A: Independent Samples t-test should be used here.
Q: SUMMARY OUTPUT Regression Statistics Multiple R R Square Adjusted R S 0.3979933 0.63629661…
A: Given Information:
Q: Width Channel Length 1 5 0.7 0.8 0.8 0.9 1.0 0.8 0.8 0.9 0.9 1.0 3 0.9 1.0 1.7 2.0 4.0 4 1.0 1.5 2.0…
A: Given Information:- Width Channel 1 Channel 2 Channel 3 Channel 4 1 0.7 0.8 0.9 1 2 0.8 0.8…
Q: 1) The SPSS output give the selling price, square footage, number of bedrooms, and age of houses…
A: Thank you for posting the question. As your question has more than 3 parts, as per the policy, we…
Q: A regression model relating x, number of salespersons at a branch office, to y, annual sales at the…
A: Hey there! Thank you for posting the question. Since your question has more than 3 parts, we are…
Q: 12. List the regression equation for the output presented below. If someone has scores of 7 on X and…
A: 12. The regression equation for the output presented is as follows: Y'=2.911+0.75(x)-0.080(z) The…
Q: independent variables. SUMMARY OUTPUT Regression Statistics Multiple R 0.857 0.734 R Square Adjusted…
A: We want to tell you regression coefficients and interpretation
Q: a. What can you say about the strength of this relationship for the model using the F test? Use α =…
A:
Q: Round your answers to 4 decimal places. a. Complete the missing entries in this Excel Regression…
A: From the given table It is provided that the F-statistic value is 52.29. and degree of freedom for…
Q: SUMMARY OUTPUT Regression Statistics Multiple R R Square Adjusted R Sq Standard Error Observations…
A: A) R square value=0.8148 i.e. 81.48% of the variability in the model is explained by the regression.…
Q: Regression Statistics Multiple R R Square 0.70955 0.503461 Adjusted R Square 0.410359 Standard Error…
A: 1. Adjusted Coefficient of Determination, Adjusted R2= 0.410359 It measures the proportion of…
Q: SUMMARY OUTPUT Regression Statistics Multiple R…
A:
Q: We give JMP output of regression analysis. Above output we give the regression model and the number…
A: There are 3 independent variables and 1 dependent variable. This is multiple regression analysis. We…
Q: The admission officer for Clearwater College developed the following estimated regression equation…
A: Significance F: The degrees of freedom for regression is 2 and the degrees of freedom for residual…
Do we reject the hypothesis of the attached file?
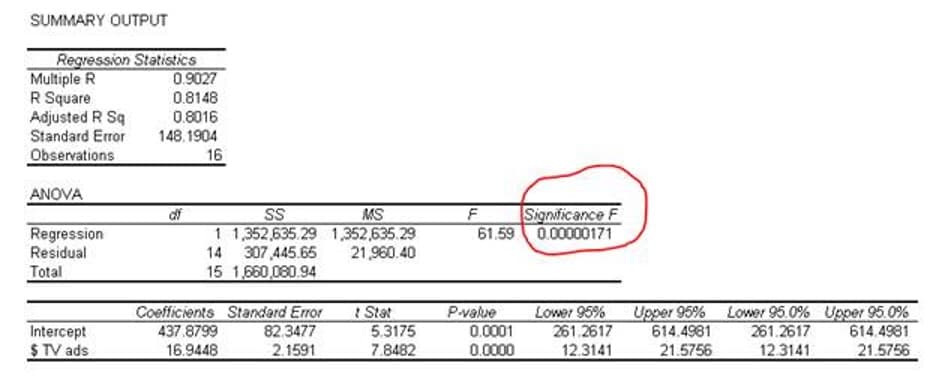
Step by step
Solved in 2 steps
- The processing of raw coal involves “washing,” in which coal ash (nonorganic, incombustible material) is removed. The article “Quantifying Sampling Precision for Coal Ash Using Gy’s Discrete Model of the Fundamental Error” (Journal of Coal Quality, 1989:33–39) provides data relating the percentage of ash to the volume of a coal particle. The average percentage of ash for six volumes of coal particles was measured. The data are as follows: Volume (cm3) 0.01 0.06 0.58 2.24 15.55 276.02 Percent ash 3.32 4.05 5.69 7.06 8.17 9.36 Using the most appropriate model, construct a 95% confidence interval for the mean percent ash for particles with a volume of 50 cm3. Round the answers to three decimal places. The 95% confidence interval is , .The processing of raw coal involves “washing,” in which coal ash (nonorganic, incombustible material) is removed. The article “Quantifying Sampling Precision for Coal Ash Using Gy’s Discrete Model of the Fundamental Error” (Journal of Coal Quality, 1989:33–39) provides data relating the percentage of ash to the volume of a coal particle. The average percentage of ash for six volumes of coal particles was measured. The data are as follows: Volume (cm3) 0.01 0.06 0.58 2.24 15.55 276.02 Percent ash 3.32 4.05 5.69 7.06 8.17 9.36 Using the most appropriate model, predict the percent ash for particles with a volume of 48 cm3. Round answer to three decimal places.The supervisor of an orange juice-bottling company is considering the purchase of a new machine to bottle 16-fluid-ounce (473-milliliter) bottles of 100% pure orange juice and wants an estimate of the difference in the mean filling weights between the new machine and the old machine. Random samples of bottles of orange juice that had been filled by both machines were obtained. Estimate the difference in the mean filling weights between the new and the old machines? Dis- cuss the assumptions. Use α = 0.10. New Machine Old MachineMean 470 milliliters 460 millilitersStandard deviation 5 milliliters 7 millilitersSample size 15 12
- Calories in Fast-Food Sandwiches Three popular fast-food restaurant franchises specializing in burgers were surveyed to find out the number of calories in their frequently ordered sandwiches. At the α=0.05 level of significance, can it be concluded that a difference in mean number of calories per burger exists? FF #1 FF #2 FF #3 340 740 710 290 540 500 1250 510 410 1010 440 390 390 H0: u1=u2=u3=u4 --------- claim or not?H1: At least one mean is different from the others--------claim or not? Find the critical value Compute the test value: F = Reject or do not reject the null hypothesis Summarize: Is there or is there not enough evidence to support claim?Is there or is there not enough evidence to reject the claim?The normal quantile plot shown to the right represents duration times (in seconds) of eruptions of a certain geyser from the accompanying data set. Examine the normal quantile plot and determine whether it depicts sample data from a population with a normal distribution. Data Table Duration (sec) 252 250 215 225 128 245 263 240 247 269 292 243 272 110 240 261 233 252 255 252 257 245 236 234 274 282 178 255 268 252 288 256 271 250 239 274 251 268 255 237A manufacturing process produces auto tires. A sample of miles at replacement is recorded below. At what milage should the warranty be set at for warranty replacement of 0.5% of the tires? Mileage at Replacement 47391 49450 52700 42709 46753 42082 53801 43975 51014 47729 49942 45216 60679 46353 52155 51420 45398 57044 51170 52729 54830 53273 48308 50209 53397 47329 54888 52780 52883 45158 48575 46073 45900 49406 47717 53113 44880 49642 47241 54091 50185 47824 54659 49625 52670 56983 44403 52557 55324 52183
- Baby weights: Following are weights in pounds for random samples of 16 newborn baby boys and baby girls. Box plots indicate that the samples come from populations that are approximately normal. Let μ1 denote the mean weight of boys. Can you conclude that the mean weight of boys is greater than the mean weight of girls? Use the =α0.10 level and the critical value method with the table. Boys 8.1 7.9 8.3 7.3 6.4 8.4 8.5 6.9 6.3 7.4 7.8 7.5 6.9 7.8 8.6 7.7 Girls 6.7 8.2 7.5 5.7 6.6 6.4 8.5 7.2 6.9 8.2 6.5 6.7 7.2 6.3 5.9 8.1 Step1: State the null and alternate hypothesis. Step 2: Choose a significance level and find the critical value. Step3: Compute the test statistic. Step 4: Determine whether to reject H0 .The ages of the winners of a cycling tournament are aproximately bell-shaped. The mean age is 28.2 years, with a standard deviation of 3.7 years. The winner in one recent year was 29 years old. a) Transform the age to a z-score b) Interpret the results c) Determne whether the age is unusual. ---------------------------------------------------------- a) transform the age to a z-score z=_____ type an integer or decimal rounded to two decimal places as needed2. The table shows the score obtained by applicants for secretarial position in a certain manufacturing company. Determine the value of the following:(2 decimal places) a. Mean b. Median c. Standard deviation d. Skewness (3 decimal places) d .1 (Interpret the result) e. Q1 f. Q3 g. Q h. P90 i. P10 j. Kurtosis (3 decimal places) j. 1 (Interpret the result) Scores Frequency82-90 373-81 964-72 1855-63 1546-54 2237-45 3728-36 119-27 310-18 2c = ___ n = _____