
Videos
The Walt Disney Company (DIS) has four business segments, described as follows:
• Media Networks: Television and radio
• Parks and Resorts: Resorts, including Disneyland
• Studio Entertainment: Motion pictures, musical recordings, and stage plays
• Consumer Products & Interactive Media: Character merchandising, Disney stores, books, and games
Disney recently reported segment operating income, revenue, and invested assets (in millions) as follows:
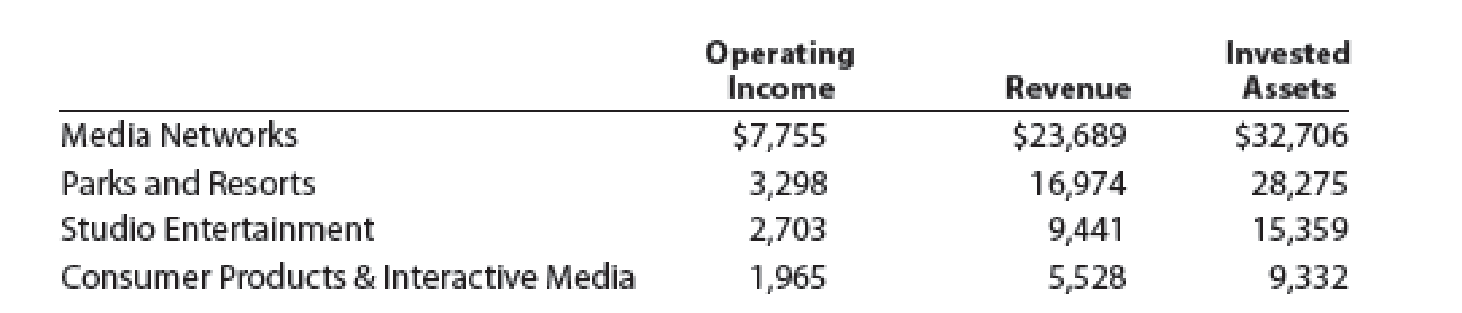
a. Use the DuPont formula to determine the
b. How do the four segments differ in their profit margin, investment turnover, and return on investment?

Trending nowThis is a popular solution!

Chapter 10 Solutions
Managerial Accounting


- Return on investment Commodore Entertainment has four profitable business segments, described as follows: • Media Networks: Television and radio• Parks and Resorts: Resorts, including Commodore land• Studio Entertainment: Motion pictures, musical recordings, and stage plays• Consumer Products: Character merchandising, Commodore stores, books, and magazines Commodore Entertainment recently reported sector income from operations, revenue, and invested assets as follows: Income from Operations Revenue Invested Assets Media Networks $193,644 $586,800 $978,000 Parks and Resorts 63,954 392,700 561,000 Studio Entertainment 12,927 333,600 417,000 Consumer Products 118,233 469,800 261,000 a. Use the DuPont formula to determine the return on investment for the four Commodore Entertainment sectors. Round Profit Margin and ROI to one decimal place and Investment Turnover to two decimal places. Profit Margin Investment Turnover ROI…arrow_forwardMacon Mills is a division of Bolin Products, Inc. During the most recent year, Macon had a net income of $40 million. Total assets were $470 million, non-interest-bearing current liabilities were $72,000,000. What are the invested capital and ROI for Macon? Solution What is the invested capital (Total Assets – Non-Interest-Bearing Current Liabilities)? What is the ROI (Net Income/Invested Capital)?arrow_forwardThe information for three businesses operating in the same industry is provided in the table that follows: BUSINESS COMPANY A COMPANY B COMPANY C Sales $ 300,000 $ 420,000 $ 380,000 Net income $ 18,000 $ 20,000 $ 19,000 Net profit margin ? ? ? Based on this data, calculate the net profit margin for each company. What is an analyst most likely to conclude about the profitability of the businesses? Group of answer choices Company A, is more profitable than company B and more profitable than company C. Company C is more profitable than company A, but less profitable than company B. Company B is more profitable than company A and less profitable than company C. Company C is more profitable than company A and less profitable than company B.arrow_forward
- Disney started inthe 1920sasan animation studio.How has the company diversified its offering since then?Analyze the company’smost current“FiscalAnnual Report†to find out its primary revenue streams. What are the primary businesses that Disney operates today?arrow_forwardAs consultants in advisory services, we are hired by Sayko Corp to help analyze its regional operations in the contiguous U.S. Sayko wishes to draw on our expertise in financial statement analysis to help identify further expansion of operations. Please complete the following based on the information on the map (image): 1. Compute profit margin for each region.2. The company asks us which region it should focus on if it wishes to get the largest net income from each dollar of sales. If we use profit margin to guide our recommendation, which region do we suggest?3. Compute return on total assets for each region.4. The company asks us which region it should focus on if it wishes to get the largest net income from each dollar of assets invested. If we use return on total assets to make our decision, which region do we recommend?arrow_forwardMacon Mills is a division of Bolin Products, Inc. During the most recent year, Macon had a net income of $40 million. Total assets were $470 million, non-interest-bearing current liabilities were $72,000,000. What are the invested capital and ROI for Macon? Solution What is the invested capital (Total Assets – Non-Interest-Bearing Current Liabilities)? What is the ROI (Net Income/Invested Capital)? Please don't provide answer in image format thank youarrow_forward
- As consultants in advisory services, we are hired by Sayko Corp to help analyze its regional operations in the contiguous U.S. Sayko wishes to draw on our expertise in financial statement analysis to help identify further expansion of operations. A Tableau Dashboard is provided to aid our analysis. 1. Compute profit margin for each region.2. The company asks us which region it should focus on if it wishes to get the largest net income from each dollar of sales. If we use profit margin to guide our recommendation, which region do we suggest?3. Compute return on total assets for each region.4. The company asks us which region it should focus on if it wishes to get the largest net income from each dollar of assets invested. If we use return on total assets to make our decision, which region do we recommend?arrow_forwardCarson Electronics’ management has long viewed BGT Electronics as an industry leader and uses this firm as a model firm for analyzing its own performance. The balance sheet and income statements for the two firms are as follows: Calculate the following ratios for both Carson and BGT: a)Total asset turnover: b) Operating profit margin: c) Operating return on assets:arrow_forwardCarson Electronics’ management has long viewed BGT Electronics as an industry leader and uses this firm as a model firm for analyzing its own performance. The balance sheet and income statements for the two firms are as follows: Calculate the following ratios for both Carson and BGT: a) Current ratio: b) Times interest earned: c) Inventory turnover:arrow_forward
- AT&T and Verizon produce and market telecommunications products and are competitors. Key financial figures for these businesses for a recent year follow. Which company is more successful in returning net income from its assets invested?arrow_forwardAT&T and Verizon produce and market telecommunications products and are competitors. Key financial figures for these businesses for a recent year follow. Key Figures ($ millions) AT&T Verizon Sales . $126,723 $110,875 Net income . 4,184 10,198 Average assets . . . . . . . . . . . . . . . . . . . . 269,868 225,233 Required 1. Compute return on assets for (a) AT&T and (b) Verizon. 2. Which company is more successful in the total amount of sales to consumers? 3. Which company is more successful in returning net income from its assets invested?arrow_forwardRiver Valley Production Inc. seeks to increase its market share and improve its results. The company takes as a starting point the current scenario and the results obtained in 2018 and 2019. Like other companies, River Valley uses financial ratios (ratios) as tools for analyzing the results obtained at the end of the period. Consider the data presented in the financial statements below and analyze the company's results based on the financial ratios.1. Use the financial statements to calculate the following financial ratios for the years 2018 and 2019:1.8 Return on Investment (ROI)1.9 Profit Margin1.10 Debt to Equity Ratio1.11 Price/Earning Ratio Balance Sheet 2018 2019 Cash $63,000 $201,000 Accounts Receivable 199,000 305,000 Marketable Securities 81,000 42,000 Inventories 441,000 455,000 Prepaids 5,000 9,000 Total Current Assets 789,000 1,012,000 Property, Plant, and Equipment, net 858,000 858,000…arrow_forward
 Managerial AccountingAccountingISBN:9781337912020Author:Carl Warren, Ph.d. Cma William B. TaylerPublisher:South-Western College Pub
 Financial And Managerial AccountingAccountingISBN:9781337902663Author:WARREN, Carl S.Publisher:Cengage Learning,
 Cornerstones of Cost Management (Cornerstones Ser...AccountingISBN:9781305970663Author:Don R. Hansen, Maryanne M. MowenPublisher:Cengage Learning
 Financial Reporting, Financial Statement Analysis...FinanceISBN:9781285190907Author:James M. Wahlen, Stephen P. Baginski, Mark BradshawPublisher:Cengage Learning