
Videos
Real Estate Marjory Duffin has persuaded John O’Hagan to consider investing a portion of OHaganBooks.com profits in real estate, now that the real estate market seems to have bottomed out. A real-estate broker friend of hers emailed her the following (somewhat optimistic) graph from brokersadvocacy.com:
Home price index
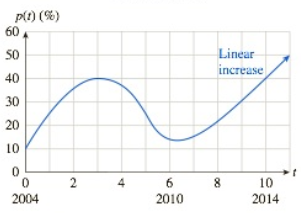
Here,
a. Assuming that the trend shown in the graph continues indefinitely, estimate
b. Estimate
Want to see the full answer?
Check out a sample textbook solution
Chapter 10 Solutions
Finite Mathematics and Applied Calculus (MindTap Course List)
Additional Math Textbook Solutions
Calculus & Its Applications (14th Edition)
Precalculus
Glencoe Math Accelerated, Student Edition
Calculus 2012 Student Edition (by Finney/Demana/Waits/Kennedy)
Calculus: Single And Multivariable


- discuss the trend analysis of the oil palm pricingarrow_forwardConsider the given data for the percent of participation of the 18-24-year-old group, y, as a function of years after 1964, x as below: year x y 1964 0 51.0 1968 4 50.0 1972 8 49.0 1976 12 42.0 1980 16 40.0 1984 20 42.0 1988 24 36.0 1992 28 44.0 1996 32 32.0 2000 36 32.0 2004 40 43.0 2008 44 45.0 2012 48 38.0 Create a linear model of the trend for the percent of participation of the 18-24-year-old group, y, as a function of years after 1964, x, using Desmos.arrow_forwardthe following table showsthe relationship between your wealth and your utility.arrow_forward
- Does the following table of market data suggest a linear relationship between price and number of homes sold during a one-year period? Explain. Price ( thousands of $) 180 195 220 240 No. of homes sold 127 118 103 91arrow_forwardA scatterplot with no linear trend will have an r value of zero true or false?arrow_forwardWhat does the slope of the trend line represent?arrow_forward
 Glencoe Algebra 1, Student Edition, 9780079039897...AlgebraISBN:9780079039897Author:CarterPublisher:McGraw Hill