(a)
Interpretation:
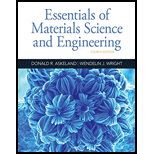
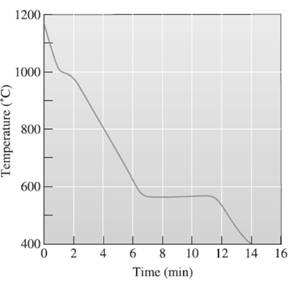
The pouring temperature needs to be determined, from the provided temperature vs time, cooling curve for Al-Si.
Concept Introduction:
A cooling curve is a schematic representation of phase change of matter, characteristically from liquid to solid or gaseous to solid.
The temperature is plotted on Y-axis.
The time is plotted on X-axis.
In this variable, time is independent variable and temperature is a dependent variable.
The initial point of the graph is designated as 'pouring temperature'.
(b)
Interpretation:
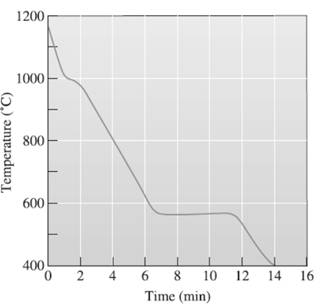
The superheat temperature needs to be determined.
Concept Introduction:
A cooling curve is a schematic representation of phase change of matter, characteristically from liquid to solid or gaseous to solid.
The temperature is plotted on Y-axis.
The time is plotted on X-axis.
In this variable, time is independent variable and temperature is a dependent variable.
The initial point of the graph is designated as 'pouring temperature'.
(c)
Interpretation:
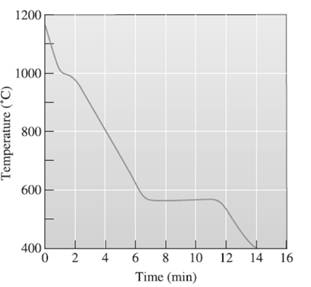
The liquidus temperature needs to be determined.
Concept Introduction:
A cooling curve is a schematic representation of phase change of matter, characteristically from liquid to solid or gaseous to solid.
The temperature is plotted on Y-axis.
The time is plotted on X-axis.
In this variable, time is independent variable and temperature is a dependent variable.
The initial point of the graph is designated as 'pouring temperature'.
(d)
Interpretation:
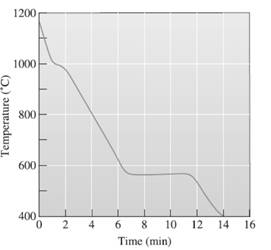
The eutectic temperature needs to be determined.
Concept Introduction:
A cooling curve is a schematic representation of phase change of matter, characteristically from liquid to solid or gaseous to solid.
The temperature is plotted on Y-axis.
The time is plotted on X-axis.
In this variable, time is independent variable and temperature is a dependent variable.
The initial point of the graph is designated as 'pouring temperature'.
(e)
Interpretation:
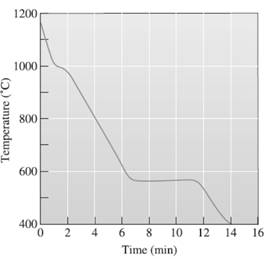
The freezing range temperature needs to be determined.
Concept Introduction:
A cooling curve is a schematic representation of phase change of matter, characteristically from liquid to solid or gaseous to solid.
The temperature is plotted on Y-axis.
The time is plotted on X-axis.
In this variable, time is independent variable and temperature is a dependent variable.
The initial point of the graph is designated as 'pouring temperature'.
(f)
Interpretation:
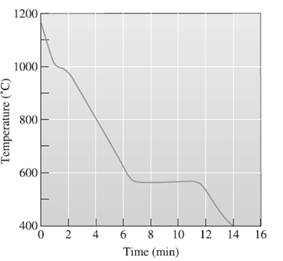
The local solidification time needs to be determined.
Concept Introduction:
A cooling curve is a schematic representation of phase change of matter, characteristically from liquid to solid or gaseous to solid.
The temperature is plotted on Y-axis.
The time is plotted on X-axis.
In this variable, time is independent variable and temperature is a dependent variable.
The initial point of the graph is designated as 'pouring temperature'.
(g)
Interpretation:
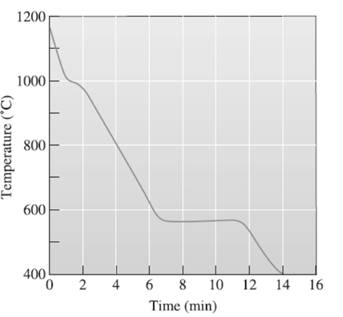
The total solidification temperature needs to be determined.
Concept Introduction:
A cooling curve is a schematic representation of phase change of matter, characteristically from liquid to solid or gaseous to solid.
The temperature is plotted on Y-axis.
The time is plotted on X-axis.
In this variable, time is independent variable and temperature is a dependent variable.
The initial point of the graph is designated as 'pouring temperature'.
(h)
Interpretation:
The composition of alloy needs to be determined.
Concept Introduction:
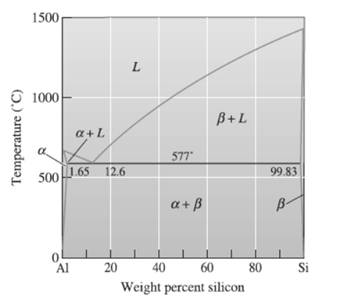
Phase diagram is used to represent the
Trending nowThis is a popular solution!

Chapter 11 Solutions
Essentials Of Materials Science And Engineering
 MATLAB: An Introduction with ApplicationsEngineeringISBN:9781119256830Author:Amos GilatPublisher:John Wiley & Sons Inc
 Essentials Of Materials Science And EngineeringEngineeringISBN:9781337385497Author:WRIGHT, Wendelin J.Publisher:Cengage,
 Industrial Motor ControlEngineeringISBN:9781133691808Author:Stephen HermanPublisher:Cengage Learning
 Basics Of Engineering EconomyEngineeringISBN:9780073376356Author:Leland Blank, Anthony TarquinPublisher:MCGRAW-HILL HIGHER EDUCATION
 Structural Steel Design (6th Edition)EngineeringISBN:9780134589657Author:Jack C. McCormac, Stephen F. CsernakPublisher:PEARSON
 Fundamentals of Materials Science and Engineering...EngineeringISBN:9781119175483Author:William D. Callister Jr., David G. RethwischPublisher:WILEY


