(a)
Interpretation:
The phase diagram of the Ag-Ge system needs to be draw
Concept Introduction:
The initial two phases near the eutectic point are known as −
An intermediate phase is observed denoted by
Based on the result of in situ observations and experiment of high-pressure quenching, the possible all phase diagram of the two alloys is drawn at pressure GPa.
The phase of Ag-Ge
Answer to Problem 11.46P
The phase of Ag-rich and Ge-rich composition is represented as follows:

Explanation of Solution
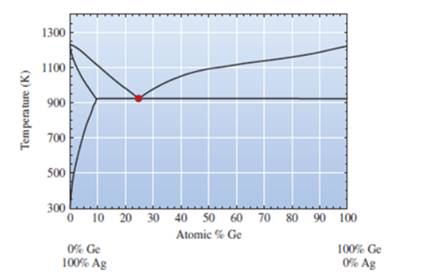
From the phase diagram of Ag-Ge system as shown below:
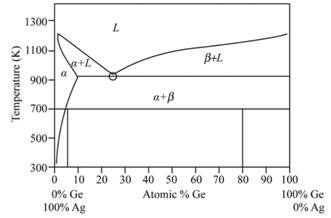
Ge - rich solid phase denoted by
Ag - rich solid phase denoted by
L − Liquid phase
(b)
Interpretation:
The compositions and the amounts of the phases present in Ag-Ge system needs to be determined.
Concept Introduction:
Phase diagram of Ag-Ge system is as given below:

Initial two phases near the eutectic point are observed as −
An intermediate phase is observed denoted by
Based on the result of in situ observations and experiment of high-pressure quenching, the possible all phase diagram of the two alloys is drawn at pressure
The phase drawn of Ag-Ge region is called as the sub monolayer region.
Answer to Problem 11.46P
The composition of the phase diagram Ag-Ge is made up of
Explanation of Solution
Given:
Ge =
Ag =
Temperature T=
Calculation:
From the given figure, we get to know that,
At
Hence, we want to determine the amount of all phase of
Consider −
a =
b =
c =
X = amount of Ge present in alloy
Hence, at
(c)
Interpretation:
The transformation in phases that occur on solidification from the melt at the point marked with a circle needs to be explained and the special name needs to be given to this transformation.
Concept Introduction:
Solidification is also called as the process of freezing. The freezing point of liquid is higher than the temperature of liquid changed into the solid state which is called as freezing. Internationally, freezing is solidification where change of liquid phase or liquid content occurs because of the cooling effect.
For a greater number of substances, the freezing and melting temperature is available at the same temperature whereas some substances having different transition temperature of liquid-solid state.
Answer to Problem 11.46P
The marked point in the figure is known as the eutectic point.
Explanation of Solution
Given Information:
From the given figure, the marked point is the eutectic point as a transformation from the liquid state to the solid state is occurring.
The eutectic reaction for the eutectic point is
Here, L= liquid phase
Hence during solidification, the liquid phase is converted into the liquid phases at the eutectic points.
(d)
Interpretation:
A schematic diagram illustrating the final microstructure of
Concept Introduction:
Phase diagram of Ag-Ge system is represented as follows:

Initial two phases near the eutectic point are given as −
An intermediate phase is observed denoted by
Based on the result of in situ observations and experiment of high-pressure quenching, the possible all phase diagram of the two alloys is drawn at pressure
The phase drawn of Ag-Ge region is called as sub monolayer region
Answer to Problem 11.46P
The composition of
Explanation of Solution
From the phase diagram of Ag-Ge, we get to know that composition of
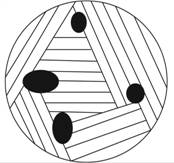
Thus, the composition of
(e)
Interpretation:
The stronger sample from the two given samples at room temperature in Ag-Ge system needs to be determined.
Concept Introduction:
Phase diagram of Ag-Ge system is represented as follows:

Initial two phase near the eutectic point are given as −
An intermediate phase is observed denoted by
Based on the result of in situ observations and experiment of high-pressure quenching, the possible all phase diagram of the two alloys is drawn at pressure
The phase drawn of Ag-Ge region is called as the sub monolayer region.
Answer to Problem 11.46P
Ag-
Explanation of Solution
The micro-hardness of material has a direct relationship with the strength of the material and the wear resistance of compositions. Hence, for determination of the properties of the material, this micro-hardness measurement is to be considered. When there is a use of different microstructures and compositions, then the properties of the materials get varied.
In compositions,
Thus, Ag-
Want to see more full solutions like this?
Chapter 11 Solutions
Essentials Of Materials Science And Engineering

 MATLAB: An Introduction with ApplicationsEngineeringISBN:9781119256830Author:Amos GilatPublisher:John Wiley & Sons Inc
 Essentials Of Materials Science And EngineeringEngineeringISBN:9781337385497Author:WRIGHT, Wendelin J.Publisher:Cengage,
 Industrial Motor ControlEngineeringISBN:9781133691808Author:Stephen HermanPublisher:Cengage Learning
 Basics Of Engineering EconomyEngineeringISBN:9780073376356Author:Leland Blank, Anthony TarquinPublisher:MCGRAW-HILL HIGHER EDUCATION
 Structural Steel Design (6th Edition)EngineeringISBN:9780134589657Author:Jack C. McCormac, Stephen F. CsernakPublisher:PEARSON
 Fundamentals of Materials Science and Engineering...EngineeringISBN:9781119175483Author:William D. Callister Jr., David G. RethwischPublisher:WILEY