
Videos
Preliminary data analyses and other information suggest that you can reasonably assume that the variables under consideration in Exercises 11.21–11.26 are
11.24 Premade Pizza. Homestyle Pizza of Camp Verde, Arizona, provides baking instructions for its premade pizzas. According to the instructions, the average baking time is 12 to 18 minutes. If the times are normally distributed, the standard deviation of the times should be approximately 1 minute. A random sample of 15 pizzas yielded the following baking times to the nearest tenth of a minute.
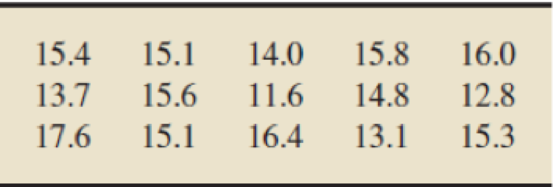
At the 1% significance level, do the data provide sufficient evidence to conclude that the standard deviation of baking times exceeds 1 minute? (Note: The sample standard deviation of the 15 baking limes is 1.54 minutes.)
Want to see the full answer?
Check out a sample textbook solution
Chapter 11 Solutions
Introductory Statistics (10th Edition)


- "In your response indicate whether CPAs in states that have flat state income tax rates work fewer hours per week during tax season compared to the US average. You will want to formally set up H0 and Ha, report either the test statistic (z-value) or p-value, and explain why you either reject or fail to reject your null hypothesis."arrow_forwardA biologist was interested in determining whether specific seedlings treated with a new fertilizer resulted in a higher than average height than the standard height of 11.2 cm. The biologist treated a random sample of 24 seedlings with the fertilizer and subsequently obtained the following heights. Conduct an appropriate hypothesis test using a 5% significance level. What is the null and alternative hypothesis? What is the value of the test stastic? Please show work. 11.5 11.8 15.7 12.1 10.1 10.5 16.5 13.5 14.4 16.7 10.9 10.0 11.1 17.1 13.3 12.4 8.5 14.3 12.9 11.1 15.0 13.3 9.9 13.5arrow_forwardUse the data below to test the claim that the weight loss was greater with the low fat diet compared to the low carbohydrate diet. Use a 5% level of significance. Low Fat Low Carbohydrate x¯1=4.7lbs1=7.2lbn1=77 x¯1=3.5lbs1=6.9lbn1=52 Identify the tail of the test. What is the P-value? Will the null hypothesis be rejected? Is the initial claim supported?arrow_forward
- In Exercises, hypothesis tests are proposed. For each hypothesis test, a.identify the variable.b.identify the two populations.c.determine the null and alternative hypotheses.d.classify the hypothesis test as two tailed, left tailed, or right tailed. Neurosurgery Operative Times. An Arizona State University professor, R. Jacobowitz, Ph.D., in consultation with G. Vishteh, M.D., and other neurosurgeons obtained data on operative times, in minutes, for both a dynamic system (Z-plate) and a static system (ALPS plate). They wanted to perform a hypothesis test to decide whether the mean operative time isless with the dynamic system than with the static system.arrow_forwardIs a baseball players' slugging percentage correlated to their strikeout percentage? A random sample of n=6n=6professional baseball players gave the following data (Source: baseball-reference.com) Slugging 0.396 0.42 0.323 0.078 0.473 0.467 Strikeouts 27 14.3 30.8 47.1 17.8 36.7 Construct a 99% confidence interval for the slope of the least squares line.(Round your answers to 2 decimal places.)Margin of error: Lower limit: Upper limit: c.) Interpret: We are % confident that the slope of the least squares line is between and .arrow_forwardA company had its sales persons undergo training, hoping to improve their sales.Past sales data indicate that the average sale was P4,000 per transaction on anormally distributed population. After training, sales data, taken from a randomsample of 25 salesmen/salesladies, indicates an average sale of P4,500 with astandard deviation of P150. (a) Write the null hypothesis. (b) Write the alternativehypothesis. (c) Formulate and calculate the test-statistic. Is it a one-tail or twotailed test? Did the training work at 95% confidence level? (d) Determine theconfidence interval.arrow_forward
- Back in April and May of 1985, the Gallup organization conducted a poll to estimate the percentage of Americans who approved of how President Reagan was handling his job. At the 5% significance level, do the data suggest that the percentage of those who approved of Reagan increased from April to May in 1985? Population 1: April p = 795/1528 = 0.5203 Population 2: May p = 840/1528 = 0.5497 Show all your steps, setting up your null and alternative hypothesis.arrow_forwardConsidering a treadmill test given to patients being tested for high blood pressure, male patients took their pulse rates before and after running for 5 min. Subject 1 2 3 4 5 6 7 8 9 10 Pulse before 64 100 85 60 92 85 68 85 85 68 Pulse after 68 115 84 68 105 92 72 88 80 92 Using a 0.05 significance level, perform the 8-step hypothesis test to test the claim that the mean difference between the pulse rates before and after the run is significantly zero. Based on the result, do the male pulse rates taken before and after running appear to be about the same or not?arrow_forwardExercise #1 Open the Excel worksheet MPGDATA.XLS from Blackboard>Excel #5 Files. The data in column A of this worksheet represent the miles per gallon gasoline consumption for a random sample of 55 makes and models of passenger cars (source: Environmental Protection Agency) Use the Excel Confidence Interval Template to: Construct a 95% confidence interval for the population mean miles per gallon consumption for passenger cars. Use the Excel Hypothesis Testing Template to: Test the hypothesis that the population mean of miles per gallon gasoline consumption for passenger cars is different from 25 mpg. Use a significance level of 5%. Do we know ? for the mpg consumption? Can we use the normal distribution for the hypothesis test? State the null and alternative hypotheses. Perform the appropriate test and print the output. Look at the p-value in the output. Compare it to ?. Do we reject the null hypothesis or not? Generate the descriptive statistics (mean, standard…arrow_forward
- Back in April and May of 1985, the Gallup organization conducted a poll to estimate the percentage of Americans who approved of how President Reagan was handling his job. At the 5% significance level, do the data suggest that the percentage of those who approved of Reagan increased from April to May in 1985? Population 1: April p = 795/1528 = 0.5203Population 2: May p = 840/1528 = 0.5497Show all your steps, setting up your null and alternative hypothesis.arrow_forwardIn the macro relation between GDP and FDI, Dr Mudenda obtained the following valuesfrom a Stata output: FDI coefficient of 0.45; t-statistic of 3; and covariance (GDP, FDI)value of 0.41. In literature, this relationship between GDP and FDI has generally beenestablished to be statistically significant. Answer the following questions:i) Calculate the variance of the FDI variable and explain its implicationii) Use the confidence interval approach to test whether FDI’s influence on GDP isstatically significant or not in Dr Mudenda’s study. Use 5% level which gives 1.96critical values.iii) What is the expected value of the p-values for studies that have been conductedin literature?arrow_forwardThe table below contains summary statistics about the trading density (sales per square metre, R/m2) for two random and independent samples of 18 housing developments in the Western Cape, and 13 housing developments in the Free State. Assume that the trading densities of the Western Cape and the Free State housing developments are normally distributed. Housing cost Western cape Free state Sample mean (R) 2500.2 2100.7 Sample standard deviation (R) 820.3 694.6 a. Estimate a 95% confidence interval for the standard deviation of the cost of housing developments in the Free State. b. Are the variances of the trading densities of housing developments in the Western Cape and the Free State are the same? Test at the 10% level. (Note: In answering this question, make sure you state the following: null and alternative hypotheses, test statistic and critical value. Write your final answers to 3 decimal places).c. Estimate a 90% confidence interval for the difference between the mean…arrow_forward
 MATLAB: An Introduction with ApplicationsStatisticsISBN:9781119256830Author:Amos GilatPublisher:John Wiley & Sons Inc
 Probability and Statistics for Engineering and th...StatisticsISBN:9781305251809Author:Jay L. DevorePublisher:Cengage Learning
 Statistics for The Behavioral Sciences (MindTap C...StatisticsISBN:9781305504912Author:Frederick J Gravetter, Larry B. WallnauPublisher:Cengage Learning
 Elementary Statistics: Picturing the World (7th E...StatisticsISBN:9780134683416Author:Ron Larson, Betsy FarberPublisher:PEARSON
 The Basic Practice of StatisticsStatisticsISBN:9781319042578Author:David S. Moore, William I. Notz, Michael A. FlignerPublisher:W. H. Freeman
 Introduction to the Practice of StatisticsStatisticsISBN:9781319013387Author:David S. Moore, George P. McCabe, Bruce A. CraigPublisher:W. H. Freeman