
Videos
Preliminary data analyses and other information indicate that you can reasonably assume that, in Exercises 11.63–11.68, the variable under consideration is
11.66 Stuttering. Researchers S. Reilly et al. studied the indicators of stuttering onset and the potential effects that stuttering may have on a child in the article “Natural History of Stuttering to 4 Years of Age: A Prospective Community-Based Study” (Pediatrics, Vol. 132, Issue 3, pp. 460–467). The following table provides the scores on the Communication and Symbolic Behavior Scale (CSBS), an assessment tool used to identify communication disorders, for random samples of stuttering and nonstuttering children.
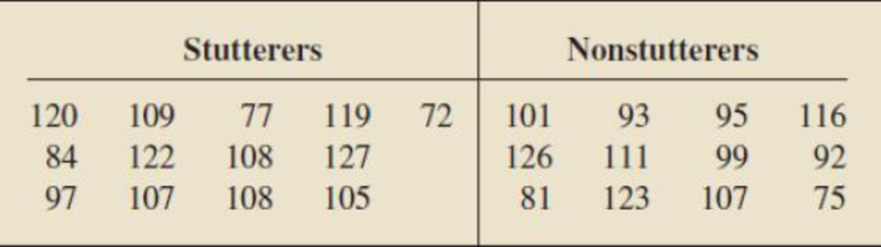
At the 10% significance level, do the data provide sufficient evidence to conclude that, in this age group, there is more variation in CSBS scores for stutterers than for nonstutterers? (Note: s1 = 17.326 and s2 = 15.745.)
Want to see the full answer?
Check out a sample textbook solution
Chapter 11 Solutions
Introductory Statistics (10th Edition)


- A researcher believes that if students experience a particular form of positive coaching, then they will be more likely to plan to continue with university preparation studies. Use the data below and Excel's ANOVA testing with α=0.02α=0.02 to test the relevant hypotheses. Control:No Coaching Treatment:Positive Coaching Year 7 62.544.753.654.252.660.754.0 62.150.853.757.757.153.658.9 Year 10 55.949.754.753.656.351.951.6 58.962.176.658.957.075.661.5 ( 1a ) What is the F value for the treatment effect? (Report answer accurate to 2 decimal place.)( 1b ) What is the p-value for the F value for the treatment effect? (Report answer accurate to 4 decimal places.) ( 2a ) What is the F value for the school-year effect? (Report answer accurate to 2 decimal place.)( 2b ) What is the p-value for the F value for the school-year effect? (Report answer accurate to 4 decimal places.)( 3a ) What is the F value for the interaction effect? (Report answer accurate to…arrow_forwardConsidering a treadmill test given to patients being tested for high blood pressure, male patients took their pulse rates before and after running for 5 min. Subject 1 2 3 4 5 6 7 8 9 10 Pulse before 64 100 85 60 92 85 68 85 85 68 Pulse after 68 115 84 68 105 92 72 88 80 92 Using a 0.05 significance level, perform the 8-step hypothesis test to test the claim that the mean difference between the pulse rates before and after the run is significantly zero. Based on the result, do the male pulse rates taken before and after running appear to be about the same or not?arrow_forwardAn independent-measures research study uses a total of 40 participants to compare two treatment conditions. What is the df value for the t statistic computed for the corresponding hypothesis test?arrow_forward
- A study was done to look at the relationship between number of vacation days employees take each year and the number of sick days they take each year. The results of the survey are shown below. Vacation Days 5 15 13 3 9 0 3 7 7 14 4 Sick Days 5 5 1 5 4 9 9 6 5 3 9 Use a level of significance of α=0.05α=0.05 to state the conclusion of the hypothesis test in the context of the study. There is statistically significant evidence to conclude that an employee who takes more vacation days will take fewer sick days than an employee who takes fewer vacation days . There is statistically significant evidence to conclude that there is a correlation between the number of vacation days taken and the number of sick days taken. Thus, the regression line is useful. There is statistically significant evidence to conclude that an employee who takes more vacation days will take more sick days than an employee who takes fewer vacation days. There is statistically insignificant evidence to…arrow_forwardA Harris Poll in 2003 asked a national sample of 2316 adults whether they favored or opposed abolishing the penny, with 59% saying that they oppose it. Determine and interpret a 90% confidence interval for the population parameter of interest. (4 decimals)arrow_forwardA professor at a large university believes that students take an average of 15 credit hours per term. A random sample of 22 students in her class of 250 students reported the following number of credit hours that they were taking: 12 12 12 13 13 14 14 14 14 15 15 15 16 16 16 16 16 17 17 18 19 21 Does this sample indicate that students are taking more credit hours than the professor believes? Test an appropriate hypothesis and state your conclusion at 5% significance level. Which method will you use to perform the test? Choose the correct one. a1-sample T test b2-sample T test c-sample Z test d-sample T teste- e1proportion Z test.arrow_forward
- A market research firm used a sample of individuals to rate the purchase potential of a particular product before and after the individuals saw a new television commercial about the product. The purchase potential ratings were based on a 0 to 10 scale, with higher values indicating a higher purchase potential. The null hypothesis stated that the mean rating "after" would be less than or equal to the mean rating "before." Rejection of this hypothesis would show that the commercial improved the mean purchase potential rating. Use = .05 and the following data to test the hypothesis and comment on the value of the commercial. Purchase Rating Purchase Rating Individual After Before Individual After Before 1 6 6 5 3 4 2 6 5 6 8 7 3 8 8 7 6 6 4 5 4 8 6 6 What are the hypotheses?H0: d is Selectgreater than or equal to 0greater than 0less than or equal to 0less than 0equal to 0not equal to 0Item 1 Ha: d is Selectgreater than or equal to 0greater than 0less than or equal to…arrow_forwardA market research firm used a sample of individuals to rate the purchase potential of a particular product before and after the individuals saw a new television commercial about the product. The purchase potential ratings were based on a 0 to 10 scale, with higher values indicating a higher purchase potential. The null hypothesis stated that the mean rating "after" would be less than or equal to the mean rating "before." Rejection of this hypothesis would show that the commercial improved the mean purchase potential rating. Use = .05 and the following data to test the hypothesis and comment on the value of the commercial. Purchase Rating Purchase Rating Individual After Before Individual After Before 1 6 5 5 3 5 2 6 4 6 9 8 3 7 7 7 7 5 4 4 3 8 6 6arrow_forwardA market research firm used a sample of individuals to rate the purchase potential of a particular product before and after the individuals saw a new television commercial about the product. The purchase potential ratings were based on a 0 to 10 scale, with higher values indicating a higher purchase potential. The null hypothesis stated that the mean rating “after”would be less than or equal to the mean rating “before.” Rejection of this hypothesis would show that the commercial improved the mean purchase potential rating. Use α = .05 and the following data to test the hypothesis and comment on the value of the commercial.arrow_forward
- College-aged adults need at least 7 hours of sleep each night to stay healthy. Sleep deprivation can lead to decreased immune system function, lack of concentration, depression, and poor memory. A simple random sample of 34 college students reports the number of hours of sleep they had last night. Is there evidence that the true population means hours of sleep for college students in the population is less than the 7 hours that are recommended? Conduct a two-tailed, one-sample t-test, with alpha set at .05. Our test statistic is 7 hours of sleep. Reported hours of sleep (n = 34): 4, 4, 6, 5, 6, 5, 5, 6, 4, 3, 6, 8, 9, 10, 8, 9, 7, 5, 4, 7, 8, 7, 5, 7, 7, 6, 7, 4, 5, 3, 7, 9, 10, 5arrow_forwardChen et al. (2000) examined the foraging behaviour of northern elephant seals (Mirounga angustirostris) that breed along the west coast of Mexico and the USA. They attached platform satellite transmitter terminals (PTTs) to 22 male seals and recorded, for each seal, the distance (km) to its main feeding area offshore and the amount of time (days) it spent at the feeding area. The results are presented below What two null hypotheses are being tested with the output shown above? What statistical conclusions would you draw about these hypotheses? Complete the regression equation by filling in the blanks (to the nearest 3 decimal places). duration = + * distance What is one biological interpretation of this relationship between duration and distance ? What % of the variation in duration at main feeding area was explained by distance to feeding area?arrow_forward
 MATLAB: An Introduction with ApplicationsStatisticsISBN:9781119256830Author:Amos GilatPublisher:John Wiley & Sons Inc
 Probability and Statistics for Engineering and th...StatisticsISBN:9781305251809Author:Jay L. DevorePublisher:Cengage Learning
 Statistics for The Behavioral Sciences (MindTap C...StatisticsISBN:9781305504912Author:Frederick J Gravetter, Larry B. WallnauPublisher:Cengage Learning
 Elementary Statistics: Picturing the World (7th E...StatisticsISBN:9780134683416Author:Ron Larson, Betsy FarberPublisher:PEARSON
 The Basic Practice of StatisticsStatisticsISBN:9781319042578Author:David S. Moore, William I. Notz, Michael A. FlignerPublisher:W. H. Freeman
 Introduction to the Practice of StatisticsStatisticsISBN:9781319013387Author:David S. Moore, George P. McCabe, Bruce A. CraigPublisher:W. H. Freeman