
Videos
Preliminary data analyses and other information indicate that you can reasonably assume that, in Exercises 11.63–11.68, the variable under consideration is
11.64 Pulmonary Hypertension. In the paper “Persistent Pulmonary Hypertension of the Neonate and Asymmetric Growth Restriction” (Obstetrics & Gynecology, Vol. 91, No. 3, pp. 336–341), M. Williams et al. reported on a study of characteristics of neonates. Infants treated for pulmonary hypertension, called the PH group, were compared with those not so treated, called the control group. One of the characteristics measured was head circumference. The following data, in centimeters (cm), are based on the results obtained by the researchers.
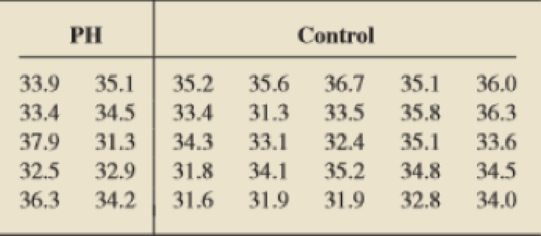
Do the data provide sufficient evidence to conclude that variation in head circumference differs among neonates treated for pulmonary hypertension and those not so treated? Perform an F-test at the 5% significance level. (Note: s1, = 1.907 and s2 = 1.594.)
Want to see the full answer?
Check out a sample textbook solution
Chapter 11 Solutions
Introductory Statistics (10th Edition)


- A Canadian study measuring depression level in teens (as reported in the Journal of Adolescence, vol. 25, 2002) randomly sampled 112 male teens and 101 female teens, and scored them on a common depression scale (higher score representing more depression). The researchers suspected that the mean depression score for male teens is higher than for female teens, and wanted to check whether data would support this hypothesis. What conclusion can you draw from the output? The data provide sufficient evidence to reject H0 and to conclude that the mean depression score for male teens is larger than that of female teens. The data provide sufficient evidence to conclude that male and female teens do not differ in mean depression score. The data do not provide sufficient evidence to conclude that the mean depression score of male teens is larger than that of female teens. The data do not provide sufficient evidence to reject H0, so we accept it, and conclude that male and female teens do…arrow_forwardThe NAEP considers that a national average of 283 is an acceptable performance. Using α = .05, run a two-tail t-test for one sample to test Ho: µ=283 for the 2019 scores. Report the t-obt, df, and p-values. Would you reject the null hypothesis that the 2019 scores come from a population with average 283? If this is the case, does it come from a population from larger or smaller average?arrow_forwardAn independent-measures research study uses a total of 40 participants to compare two treatment conditions. What is the df value for the t statistic computed for the corresponding hypothesis test?arrow_forward
- To combat antibiotic resistance, the Quality Improvement Consortium recommends a throat swab to confirm strep throat before a physician prescribes antibiotics to children under age 5. Nationally, 40 percent of children under 5 who received antibiotics did not have a throat swab. The Colorado Department of Health took a random sample of 60 children under the age of 5 who received antibiotics for throat infections and found that 18 did not have a throat swab. At α = .05, is this a statistically significant reduction over last year’s national rate of 40 percent? (a-1) Calculate the critical value. (A negative value should be indicated by a minus sign. Round your answer to 3 decimal places.) Critical value _____ (a-2) Calculate the test statistic. (A negative value should be indicated by a minus sign. Round your answer to 2 decimal places.) Test statistic _____arrow_forwardThe Firearm Injury Surveillance Study (FISS) records whether the shooting arose out of a fight and the type of firearm used to cause the injury (here, handguns vs. rifles and shotguns). With an alpha of .01, conduct a five-step hypothesis test to determine if the variables are independent. Please fill out the chart provided and provide calculations. Fight Involved Handgun Long Gun Row Marginal Yes 158A 11B 169 No 309C 133D 442 Column Marginal 467 144 N = 611 Expected Frequency Count fe Calculations χ2obt Calculations:arrow_forwardA researcher developed a regression model to predict the cost of a meal based on the summated rating (sum of ratings for food, decor,and service) and the cost per meal for 12 restaurants. The results of the study show that b1=1.4379 and Sb1=0.1397. a. At the 0.05 level of significance, is there evidence of a linear relationship between the summated rating of a restaurant and the cost of a meal? b. Construct a 95% confidence interval estimate of the population slope, β1. a. Determine the hypotheses for the test. Choose the correct answer below. A. H0: β1=0 H1: β1≠0 B. H0: β0≤0 H1: β0>0 C. H0: β1≤0 H1: β1>0 D. H0: β0≥0 H1: β0<0 E. H0: β1≥0 H1: β1<0 F. H0: β0=0 H1: β0≠0 Compute the test statistic. The test statistic is ? (Round to two decimal places as needed.) Determine the critical value(s). The critical value(s) is(are) ? (Use a comma to separate answers as needed.…arrow_forward
- To combat antibiotic resistance, the Quality Improvement Consortium recommends a throat swab to confirm strep throat before a physician prescribes antibiotics to children under age 5. Nationally, 40 percent of children under 5 who received antibiotics did not have a throat swab. The Colorado Department of Health took a random sample of 100 children under the age of 5 who received antibiotics for throat infections and found that 30 did not have a throat swab. At α = .05, is this a statistically significant reduction over last year’s national rate of 40 percent? (a-1) Choose the correct null and alternative hypotheses. H0: π ≥ .40 vs. H1: π < .40 H0: π ≤ .40 vs. H1: π > .40 H0: π = .40 vs. H1: π ≠ .40 (a-2) Calculate the critical value. (A negative value should be indicated by a minus sign. Round your answer to 3 decimal places.) Critical value (a-3) Calculate the test statistic. (A negative value should be indicated by a minus sign. Round your…arrow_forwardTo determine whether training in a series of workshops on creative thinking increases IQ scores, a total of 70 students are randomly divided into treatment and control groups of 35 each. After two months of training, the sample mean IQ for the treatment group equals 110, and the sample mean IQ for the control group equals 108. The estimated standard error equals 1.80. Using t, test the null hypothesis at the .01 level of significance. If appropriate (because the null hypothesis has been rejected), estimate the standardized effect size, construct a 99 percent confidence interval for the true population mean difference, and interpret these estimates.arrow_forwardBased on data in Figure 1, using Microsoft Excel, at 90% confidence level, can we conclude that on average, the no. of cases reported after 6/6/2021 is significantly lower than before 6/6/2021? Use the p-value approach to make your conclusion. R-naught is a measure used to describe the spreading rate of the COVID-19 disease. Based on the data in Figure 1, run a regression analysis with the aid Microsoft Excel and explain if no. of cases significantly influences the R-naught value.arrow_forward
- The manufacturer of a new model car (Camry) claims that a typical car gets 26 miles per gallon. A consumer advocacy group is skeptical of this claim and thinks that the mean gas mileage, of all Camrys may be less than 26 mpg. The group plans to perform the hypothesis test at sigma = 0.05, using a sample of 30 Camrys.H0: u=26 mpg Ha: u<26 mpg. Find the probability of making a Type II error if the true mean mpg of all Camrys is 25.8 mpg. Assume that gas mileages of Camrys are normally distributed with a standard deviation of 1.4 mpg.arrow_forwardThe following data on the left have been gathered from a randomized block design. Test for a significant difference in the treatment levels. Establish the hypotheses and reach a conclusion about the null hypothesis. Block. Treatment Level 1. 2 3 1 1.28 1.29 1.29 2. 1.40 1.36 1.35 3. 1.15 1.13 1.19 4 1.16 1.25 1.33arrow_forwardIs Seat Belt Use Independent of Cigarette Smoking?A study of seat belt users and nonusers yielded the randomly selected sample data summarized in the given table (based on data from “What Kinds of People Do Not Use Seat Belts?” by Helsing and Comstock,American Journal of Public Health,Vol. 67, No. 11). Test the claim that the amount of smoking is independent of seat belt use. A plausible theory is that people who smoke more are less concerned about their health and safety and are therefore less inclined to wear seat belts. Is this theory supported by the sample data?arrow_forward
 MATLAB: An Introduction with ApplicationsStatisticsISBN:9781119256830Author:Amos GilatPublisher:John Wiley & Sons Inc
 Probability and Statistics for Engineering and th...StatisticsISBN:9781305251809Author:Jay L. DevorePublisher:Cengage Learning
 Statistics for The Behavioral Sciences (MindTap C...StatisticsISBN:9781305504912Author:Frederick J Gravetter, Larry B. WallnauPublisher:Cengage Learning
 Elementary Statistics: Picturing the World (7th E...StatisticsISBN:9780134683416Author:Ron Larson, Betsy FarberPublisher:PEARSON
 The Basic Practice of StatisticsStatisticsISBN:9781319042578Author:David S. Moore, William I. Notz, Michael A. FlignerPublisher:W. H. Freeman
 Introduction to the Practice of StatisticsStatisticsISBN:9781319013387Author:David S. Moore, George P. McCabe, Bruce A. CraigPublisher:W. H. Freeman