Concept explainers
Videos
Developing a model for college GPA. Many colleges and universities develop regression models for predicting the GPA of incoming freshmen. This predicted GPA can then be used to make admission decisions. Although most models use many independent variables to predict GPA, we will illustrate by choosing two variables:
x1 = Verbal score on college entrance examination (percentile)
x2 = Mathematics score on college entrance examination (percentile)
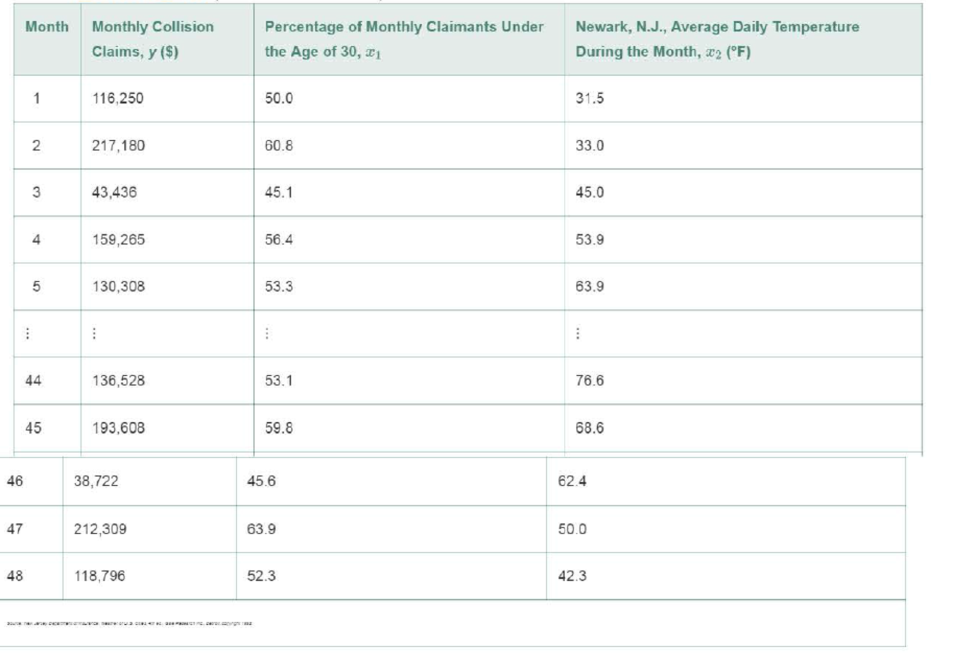
Data for Exercise 12.172 (first and last 5 months)
The file contains data on these variables for a random sample of 40 freshmen at one college. (Selected observations are shown in the table.) Use the data to develop a useful prediction equation for college freshman GPA (y). Be sure to conduct a residual analysis for the model.
| Verbal, x1 | Mathematics, x2 | GPA, y |
| 81 | 87 | 3.49 |
| 68 | 99 | 2.89 |
| 57 | 86 | 2.73 |
| 100 | 49 | 1.54 |
| 54 | 83 | 2.56 |
| ⋮ | ⋮ | ⋮ |
| 74 | 67 | 2.83 |
| 87 | 93 | 3.84 |
| 90 | 65 | 3.01 |
| 81 | 76 | 3.33 |
| 84 | 69 | 3.06 |
Want to see the full answer?
Check out a sample textbook solution
Chapter 12 Solutions
Statistics For Business And Economics Plus Mystatlab With Pearson Etext -- Access Card Package (13th Edition)


- XYZ Corporation Stock Prices The following table shows the average stock price, in dollars, of XYZ Corporation in the given month. Month Stock price January 2011 43.71 February 2011 44.22 March 2011 44.44 April 2011 45.17 May 2011 45.97 a. Find the equation of the regression line. Round the regression coefficients to three decimal places. b. Plot the data points and the regression line. c. Explain in practical terms the meaning of the slope of the regression line. d. Based on the trend of the regression line, what do you predict the stock price to be in January 2012? January 2013?arrow_forwardLife Expectancy The following table shows the average life expectancy, in years, of a child born in the given year42 Life expectancy 2005 77.6 2007 78.1 2009 78.5 2011 78.7 2013 78.8 a. Find the equation of the regression line, and explain the meaning of its slope. b. Plot the data points and the regression line. c. Explain in practical terms the meaning of the slope of the regression line. d. Based on the trend of the regression line, what do you predict as the life expectancy of a child born in 2019? e. Based on the trend of the regression line, what do you predict as the life expectancy of a child born in 1580?2300arrow_forward
 Functions and Change: A Modeling Approach to Coll...AlgebraISBN:9781337111348Author:Bruce Crauder, Benny Evans, Alan NoellPublisher:Cengage Learning
 Algebra and Trigonometry (MindTap Course List)AlgebraISBN:9781305071742Author:James Stewart, Lothar Redlin, Saleem WatsonPublisher:Cengage Learning
 College AlgebraAlgebraISBN:9781305115545Author:James Stewart, Lothar Redlin, Saleem WatsonPublisher:Cengage Learning
 Glencoe Algebra 1, Student Edition, 9780079039897...AlgebraISBN:9780079039897Author:CarterPublisher:McGraw Hill