
Concept explainers
Videos
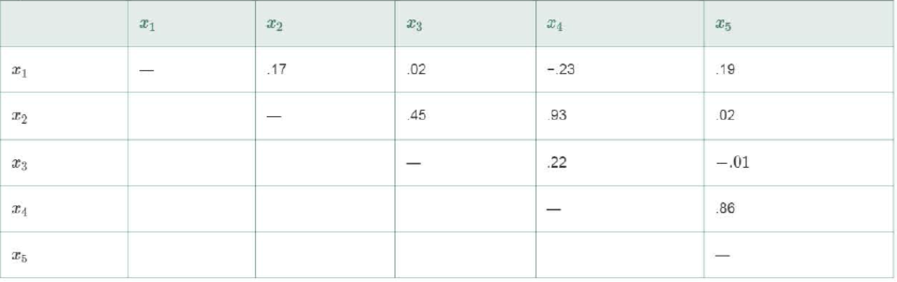
Consider fitting the multiple regression model
A matrix of
Want to see the full answer?
Check out a sample textbook solution
Chapter 12 Solutions
Statistics For Business And Economics Plus Mystatlab With Pearson Etext -- Access Card Package (13th Edition)


- If there is a positive correlation between X and Y in a research study, then the regression equation Y = bX + a will have _____. Group of answer choices b > 0. b < 0. a > 0. a < 0.arrow_forwardA linear multiple regression model is given as: Y = βo + β1 X1 + β2 X2 + μ a. Determine the parameters of this model b. Explain the circumstance under which X1 be called an endogenous variable?arrow_forwardConsider a linear regression model where y represents the response variable and x and d are the predictor variables; d is a dummy variable assuming values 1 or 0. A model with x, d, and the interaction variable xd is estimated as ŷ= 5.20 + 1.60x + 1.40d + 0.20xd.a. Compute ŷ for x = 10 and d = 1. (Round your answer to 1 decimal place.) ŷ= b. Compute yˆy^ for x = 10 and d = 0. (Round your answer to 1 decimal place.) ŷ=arrow_forward
- Look at the following regression table where the dependent variable is the demand for illegal massage services in a city in the United States. Specifically, the dependent variable is the number of customers per hour (Models 1 and 2) or per day (Models 3 and 4). (a) Explain why the coefficient for Population/1,000 in Model 2 is very different from the one in Model 4?(b) Can you reject H0 in Model 1 if H0 : βP opulation/1,000 = 0.01, H1 : βPopulation/1,000 6= 0.01, and α = 0.01?arrow_forwardConsider the linear regression model y = β0 + β1x + u, where the regressor x may be correlated with the error term u. A poor instrumental variable for the regressor x would be one that a. predicts x. b. is not entirely related to x. c. predicts y after x is controlled for. d. None of the listed answers is correct. e. is uncorrelated with u.arrow_forwardGiven the following table, use the matrix method to derive the constant and slope parametersof the sample regression function: Module test mark = f (Weekly study hours). X and Y standfor weekly study hours and module test mark respectively. X (Weekly study hours) Y (Module test mark) 1 40 2 40 3 45 4 60 5 70 6 75arrow_forward
- In an analysis of a sample of bivariate data concerning the soil acidity x (in pH) and germination time y (in days) for tomato seeds, a linear regression model is constructed and follows the equation y^=−1.22x+5y^=−1.22x+5 Select the most appropriate statement about the linear correlation exhibited. A. The data set exhibits strong positive linear correlation. B.We cannot determine anything about the strength or direction of linear correlation from this information alone. C. The data set exhibits strong negative linear correlation. D. The linear correlation coefficient is -1.22.arrow_forwardIn a typical multiple linear regression model where x1 and x2 are non-random regressors, the expected value of the response variable y given x1 and x2 is denoted by E(y | 2,, X2). Build a multiple linear regression model for E (y | *,, *2) such that the value of E(y | x1, X2) may change as the value of x2 changes but the change in the value of E(y | X1, X2) may differ in the value of x1 . How can such a potential difference be tested and estimated statistically?arrow_forwardThe average gasoline price per gallon (in cities) and the cost of a barrel of oil are shown for a random selection of weeks from 2009–2010. Oil ($) 46.25 37.51 78.00 75.39 84.88 73.78 Gasoline ($) 2.197 2.182 2.987 3.015 3.109 3.000 Use the data to calculate, round your answers to 4 decimal places. Example 0.2345 or .2345 a) r = b) r2 = c) The linear regression equation is: y = x + d) According to your model, what is the average cost per gallon of gasoline if oil costs $60.00 per barrel? The cost is $ . (Round to the nearest cent)arrow_forward
- The Simple Linear Regression model is Y = b0 + b1*X1 + u and the Multiple Linear Regression model with k variables is: Y = b0 + b1*X1 + b2*X2 + ... + bk*Xk + u Y is the dependent variable, the X1, X2, ..., Xk are the explanatory variables, b0 is the intercept, b1, b2, ..., bk are the slope coefficients, and u is the error term, Yhat represents the OLS fitted values, uhat represent the OLS residuals, b0_hat represents the OLS estimated intercept, and b1_hat, b2_hat,..., bk_hat, represent the OLS estimated slope coefficients. QUESTION 7 In the MLR model, the assumption of ‘linearity in parameters’ is violated if: one of the slope coefficients appears as a power (e.g. Y = b0 + b1*(X1^b2) + b3*X2 + u) the model includes the reciprocal of a variable (e.g. 1/X1) the model includes a variable squared (e.g. X1^2) the model includes a variable in its logarithmic form (i.e. log(X1) ) QUESTION 8 In the MLR model, the assumption of 'no perfect collinearity'…arrow_forwardThe Simple Linear Regression model is Y = b0 + b1*X1 + u and the Multiple Linear Regression model with k variables is: Y = b0 + b1*X1 + b2*X2 + ... + bk*Xk + u Y is the dependent variable, the X1, X2, ..., Xk are the explanatory variables, b0 is the intercept, b1, b2, ..., bk are the slope coefficients, and u is the error term, Yhat represents the OLS fitted values, uhat represent the OLS residuals, b0_hat represents the OLS estimated intercept, and b1_hat, b2_hat,..., bk_hat, represent the OLS estimated slope coefficients. QUESTION 1 In the SLR model, suppose the dependent variable (Y) represents the quantity consumed of apples in a particular area in tones, and the explanatory variable (X1) is the average price of apples in that area in £. If this model is estimated by OLS, then the estimated slope b1_hat, represents: by how many tones consumption of apples will change, if the average price of apples increases by £1 the predicted change in the consumption of apples (in…arrow_forwardThe Simple Linear Regression model is Y = b0 + b1*X1 + u and the Multiple Linear Regression model with k variables is: Y = b0 + b1*X1 + b2*X2 + ... + bk*Xk + u Y is the dependent variable, the X1, X2, ..., Xk are the explanatory variables, b0 is the intercept, b1, b2, ..., bk are the slope coefficients, and u is the error term, Yhat represents the OLS fitted values, uhat represent the OLS residuals, b0_hat represents the OLS estimated intercept, and b1_hat, b2_hat,..., bk_hat, represent the OLS estimated slope coefficients. QUESTION 16 In a t-test, suppose a researcher sets the significance level at 0.5%. What does this mean? The probability that the null hypothesis is true is 0.5% The researcher would be rejecting the null hypothesis, only if the p-value is less than 0.5% The researcher would be rejecting the null hypothesis, if the t-statistic is higher than 0.5 It does not mean anything, because the significance level can only be set at 5% QUESTION 17 In an MLR…arrow_forward
 Elementary Linear Algebra (MindTap Course List)AlgebraISBN:9781305658004Author:Ron LarsonPublisher:Cengage Learning