Concept explainers
Videos
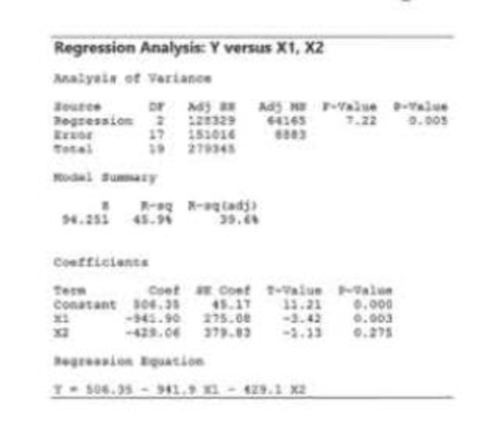
Minitab was used to fit the model E(y) = (β0 + β1x1 + β2x2 to n = 20 data points, and the printout shown below was obtained.
a. What are the sample estimates of βo, β1. and β2?
b. What is the least squares prediction equation?
c. Find SSE, MSE, and s. Interpret the standard deviation in the context of the problem.
d. Test H0: β1 = 0 against H0: β1 ≠ 0 Use α = .05.
e. Use a 95% confidence
f. Find R2 and
g. Find the test statistic for testing H0: β1 = β2 = 0.
h. Find the observed significance level of the test, part g. Interpret the result.
Want to see the full answer?
Check out a sample textbook solution
Chapter 12 Solutions
Statistics For Business And Economics Plus Mystatlab With Pearson Etext -- Access Card Package (13th Edition)


- 2. Given the following sets of information, find the linear least squares regression and the correlation coefficient.arrow_forwardA box office analyst seeks to predict opening weekend box office gross for movies. Toward this goal, the analyst plans to use online trailer views as a predictor. For each of the 66 movies, the number of online trailer views from the release of the trailer through the Saturday before a movie opens and the opening weekend box office gross (in millions of dollars) are collected and stored in the accompanying table. The least-squares regression equation for these data is Yi=−1.606+1.428Xi and the standard error of the estimate is SYX=19.348. Assume that the straight-line model is appropriate and there are no serious violations the assumptions of the least-squares regression model. Complete parts (a) and (b) below. a. At the 0.01 level of significance, is there evidence of a linear relationship between online trailer views and opening weekend box office gross? Determine the hypotheses for the test. b. Construct a 95%confidence interval estimate of the population…arrow_forwardConsider the following model:? = ?? + ?,known as the Classical Linear Regression Model (CLRM), where y is the dependent variable, X is the set of independent variables, ? is the vector of parameters to be estimated and ? is the error term.a) List and discuss the assumptions that make the Ordinary Least Squares (OLS) the Best Linear Unbiased Estimator (BLUE).b) Derive the OLS estimator and variance and discuss where each assumption is needed for the derivation of the two parameters.c) Discuss the properties of linearity, unbiasedness, and efficiency, andwhat assumption you need for each of these properties to hold.d) Present and discuss the R2 and the adjusted R2 Discuss pros and cons of each of the two statistics.arrow_forward
- The following activity and cost data that were provided by Hoist Corporation would help in estimating its future maintenance costs: Units Maintenance cost 3 P1,350 7 P1,590 11 P1,920 15 P2,100 Using the least squares regression method to estimates the cost formula, the expected total cost for an activity level of 10 units would be closest to:arrow_forwardYears of Work Experience and number of Job Offers of 10 job-seekers were as follows: Work Exp. 4 2 5 3 7 12 2 5 4 9 No. of Offers 7 1 8 4 13 19 3 11 9 15 a. Fit the regression equation of No. of Job Offers on Years of Work Experience. b. What will be the predicted number of offers for an applicant with 6 years of experience? c. Verify the relationship between the number of job offers and years of work experience using at least two relevant methodsarrow_forwardConsider the following statements: I. Multicollinearity is present when there is a high degree of linear correlation between the residuals. II. A regression analysis between weight (y in pounds) and height (x in inches) resulted in the following least squares line: y-hat = 135 + 6x + errors. This implies that if the height is increased by 1 inch, the weight increases by 6 pounds in this linear model. a. I is true and II is false. b. I is false and II is true. c. Both I and II are true. d. Both I and II are false. e. More information is needed for each statement in order to tell which is true or false.arrow_forward
- The following information pertains to a simple least squares regression for DEF Corporation: Mean value of the dependent variable 30Mean value of the independent variable 8Coefficient of the independent variable 3Number of observations 12 What is the "a" value for the leasts-quares regression model? a. 60b. 30c. 6d. 0arrow_forwardA box office analyst seeks to predict opening weekend box office gross for movies. Toward this goal, the analyst plans to use online trailer views as a predictor. For each of the 66 movies, the number of online trailer views from the release of the trailer through the Saturday before a movie opens and the opening weekend box office gross (in millions of dollars) are collected and stored in the accompanying table. The least-squares regression equation for these data isYi=−0.914+1.408Xi and the standard error of the estimate is SYX=19.887. Assume that the straight-line model is appropriate and there are no serious violations the assumptions of the least-squares regression model. Compute the test statistic.arrow_forwardA company trains its employees with instructional videos and claims that the amount of time, in hours, spent training is linearly related to an increase in productivity. The company selected a random sample of five employees to test its claim. The data were used to create the computer output for a least-squares linear regression, shown in the table. Variable DF Estimate SE Intercept 1 3.6 1.1489 Hours 1 0.8 0.3464 Which of the following is the correct test statistic and number of degrees of freedom? t=2.31 with 4 degrees of freedom A t=2.31 with 3 degrees of freedom B t=2.31 with 5 degrees of freedom C t=3.13 with 1 degree of freedom D t=3.13 with 3 degrees of freedom Earrow_forward
- Are the following statements true or false? Explain your answer.a. “An ordinary least squares regression of Y onto X will not be internallyvalid if Y is correlated with the error term.”b. “If the error term exhibits heteroskedasticity, then the estimates of Xwill always be biased.”arrow_forwardSuppose Wesley is a marine biologist who is interested in the relationship between the age and the size of male Dungeness crabs. Wesley collects data on 1,000 crabs and uses the data to develop the following least-squares regression line where ?X is the age of the crab in months and ?ˆY^ is the predicted value of ?Y, the size of the male crab in cm. ?ˆ=8.2052+0.5693?Y^=8.2052+0.5693X What is the value of ?ˆY^ when a male crab is 21.7865 months old? Provide your answer with precision to two decimal places. ?ˆ= Interpret the value of ?ˆ. The value of ?ˆ is the predicted number of crabs out of the 1,000 crabs collected that will be 21.7865 months old. the probability that a crab will be 21.7865 months old. the predicted size of a crab when it is 21.7865 months old. the predicted incremental increase in size for every increase in age by 21.7865 months.arrow_forwardIn a study measuring the relationship between height in centimeters and annual income in dollars, it has been determined that for Group 1, r2 =0.15 and for Group 2, r2 =0.10 where r denotes the correlation between the two variables. Least-squares regression lines are fitted to the observations from each group. Which of the following statement is true: A. There could be a positive relationship between the two variables for Group 1 and a negative relationship between the two variables for Group 2 B. The sum of the residuals for Group 1 is greater than the sum of the residuals for Group 2. C. Measuring the height in inches would increase the value of r2 for both groups. D. None of the answer options is true Can you also explain the difference between r and r2, and why least square regressions are used?arrow_forward
 Linear Algebra: A Modern IntroductionAlgebraISBN:9781285463247Author:David PoolePublisher:Cengage Learning
 Glencoe Algebra 1, Student Edition, 9780079039897...AlgebraISBN:9780079039897Author:CarterPublisher:McGraw Hill
 Big Ideas Math A Bridge To Success Algebra 1: Stu...AlgebraISBN:9781680331141Author:HOUGHTON MIFFLIN HARCOURTPublisher:Houghton Mifflin Harcourt