
Videos
Use the table below to answer Questions 9 and 10.
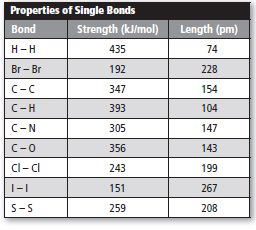
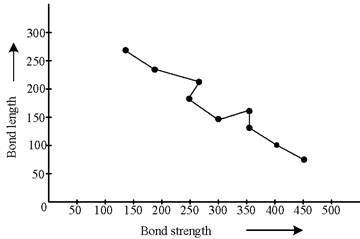
Create a graph to show how bond length varies withbond strength. Place bond strength on the x-axis.
Interpretation:
The graph plotted between bond length and bond strength needs to be explained.
Concept introduction:
The bond length is inversely proportion to bond strength.
Answer to Problem 9STP
The graph plotted between bond length and bond strength is follows as:
Explanation of Solution
Bond length is average distance between two nuclei bonded atoms while bond strength is the ability of bond which hold atoms together. Bond length depends upon differ factor such as electron affinity, size of atoms and difference between electro − negativity. In case of bond energy, higher the bond energy, shorter is the bond length.
Chapter 12 Solutions
Chemistry: Matter and Change
Additional Science Textbook Solutions
Chemistry: Structure and Properties (2nd Edition)
Organic Chemistry (9th Edition)
Chemistry: The Central Science (13th Edition)
Organic Chemistry
Introductory Chemistry (6th Edition)
Chemistry: A Molecular Approach


 ChemistryChemistryISBN:9781305957404Author:Steven S. Zumdahl, Susan A. Zumdahl, Donald J. DeCostePublisher:Cengage Learning
 ChemistryChemistryISBN:9781259911156Author:Raymond Chang Dr., Jason Overby ProfessorPublisher:McGraw-Hill Education
 Principles of Instrumental AnalysisChemistryISBN:9781305577213Author:Douglas A. Skoog, F. James Holler, Stanley R. CrouchPublisher:Cengage Learning
 Organic ChemistryChemistryISBN:9780078021558Author:Janice Gorzynski Smith Dr.Publisher:McGraw-Hill Education
 Chemistry: Principles and ReactionsChemistryISBN:9781305079373Author:William L. Masterton, Cecile N. HurleyPublisher:Cengage Learning
 Elementary Principles of Chemical Processes, Bind...ChemistryISBN:9781118431221Author:Richard M. Felder, Ronald W. Rousseau, Lisa G. BullardPublisher:WILEY