
Concept explainers
Videos
At the beginning of the last quarter of 20x1, Youngston, Inc., a consumer products firm, hired Maria Carrillo to take over one of its divisions. The division manufactured small home appliances and was struggling to survive in a very competitive market. Maria immediately requested a
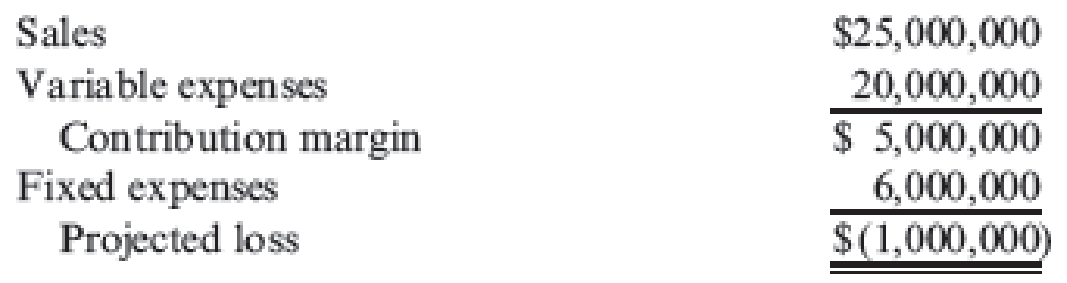
After some investigation, Maria soon realized that the products being produced had a serious problem with quality. She once again requested a special study by the controller’s office to supply a report on the level of quality costs. By the middle of November, Maria received the following report from the controller:
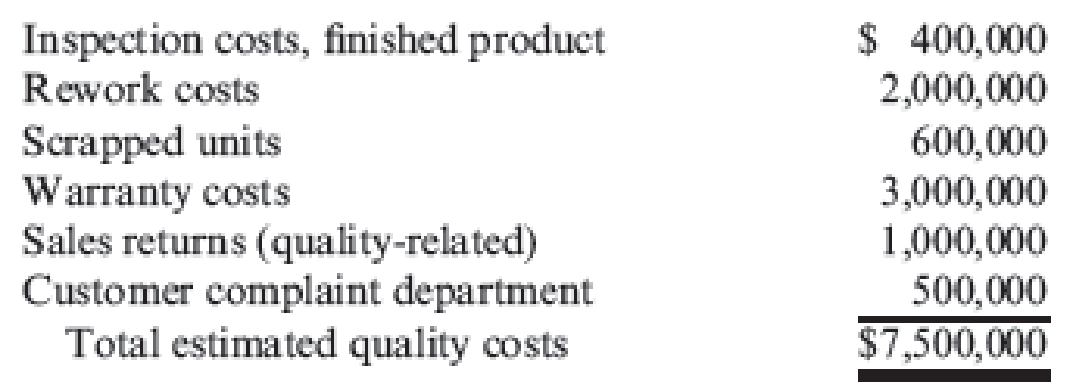
Maria was surprised at the level of quality costs. They represented 30 percent of sales, which was certainly excessive. She knew that the division had to produce high-quality products to survive. The number of defective units produced needed to be reduced dramatically. Thus, Maria decided to pursue a quality-driven turnaround strategy. Revenue growth and cost reduction could both be achieved if quality could be improved. By growing revenues and decreasing costs, profitability could be increased.
After meeting with the managers of production, marketing, purchasing, and human resources, Maria made the following decisions, effective immediately (end of November 20x1):
- a. More will be invested in employee training. Workers will be trained to detect quality problems and empowered to make improvements. Workers will be allowed a bonus of 10 percent of any cost savings produced by their suggested improvements.
- b. Two design engineers will be hired immediately, with expectations of hiring one or two more within a year. These engineers will be in charge of redesigning processes and products with the objective of improving quality. They will also be given the responsibility of working with selected suppliers to help improve the quality of their products and processes. Design engineers were considered a strategic necessity.
- c. Implement a new process: evaluation and selection of suppliers. This new process has the objective of selecting a group of suppliers that are willing and capable of providing nondefective components.
- d. Effective immediately, the division will begin inspecting purchased components. According to production, many of the quality problems are caused by defective components purchased from outside suppliers. Incoming inspection is viewed as a transitional activity. Once the division has developed a group of suppliers capable of delivering nondefective components, this activity will be eliminated.
- e. Within three years, the goal is to produce products with a defect rate less than 0.10 percent. By reducing the defect rate to this level, marketing is confident that market share will increase by at least 50 percent (as a consequence of increased customer satisfaction). Products with better quality will help establish an improved product image and reputation, allowing the division to capture new customers and increase market share.
- f. Accounting will be given the charge to install a quality information reporting system. Daily reports on operational quality data (e.g., percentage of defective units), weekly updates of trend graphs (posted throughout the division), and quarterly cost reports are the types of information required.
- g. To help direct the improvements in quality activities, kaizen costing is to be implemented. For example, for the year 20x1, a kaizen standard of 6 percent of the selling price per unit was set for rework costs, a 25 percent reduction from the current actual cost.
To ensure that the quality improvements were directed and translated into concrete financial outcomes, Maria also began to implement a Balanced Scorecard for the division. By the end of 20x2, progress was being made. Sales had increased to $26,000,000, and the kaizen improvements were meeting or beating expectations. For example, rework costs had dropped to $1,500,000.
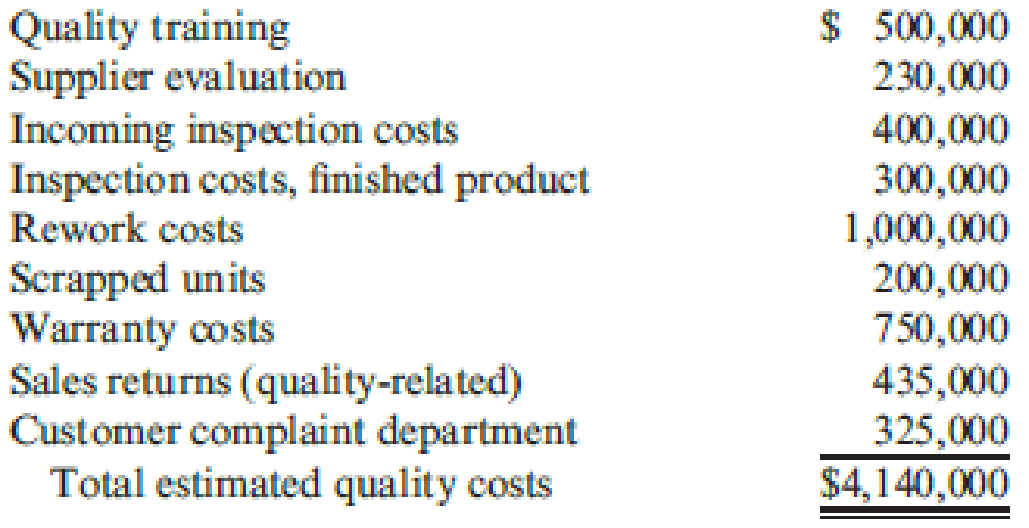
At the end of 20x3, two years after the turnaround quality strategy was implemented, Maria received the following quality cost report:
Maria also received an income statement for 20x3:
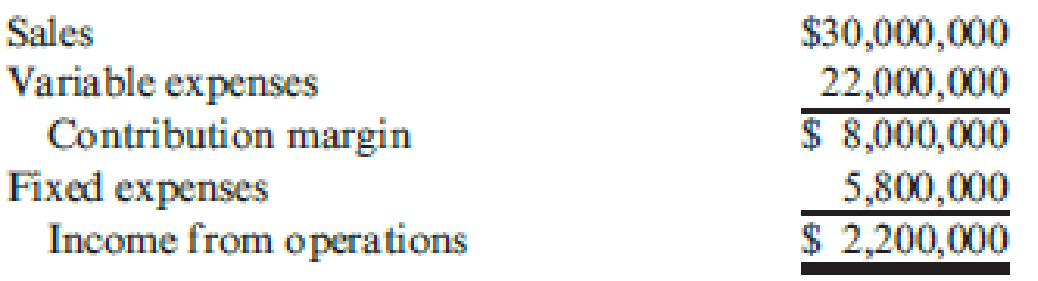
Maria was pleased with the outcomes. Revenues had grown, and costs had been reduced by at least as much as she had projected for the two-year period. Growth next year should be even greater as she was beginning to observe a favorable effect from the higher-quality products. Also, further quality cost reductions should materialize as incoming inspections were showing much higher-quality purchased components.
Required:
- 1. Identify the strategic objectives, classified by the Balanced Scorecard perspective. Next, suggest measures for each objective.
- 2. Using the results from Requirement 1, describe Maria’s strategy using a series of if-then statements. Next, prepare a strategy map.
- 3. Explain how you would evaluate the success of the quality-driven turnaround strategy. What additional information would you like to have for this evaluation?
- 4. Explain why Maria felt that the Balanced Scorecard would increase the likelihood that the turnaround strategy would actually produce good financial outcomes.
- 5. Advise Maria on how to encourage her employees to align their actions and behavior with the turnaround strategy.

Trending nowThis is a popular solution!

Chapter 13 Solutions
Cornerstones of Cost Management (Cornerstones Series)


- In 20X1, Don Blackburn, president of Price Electronics, received a report indicating that quality costs were 31% of sales. Faced with increasing pressures from imported goods. Don resolved to take measures to improve the overall quality of the companys products. After hiring a consultant in 20X1, the company began an aggressive program of total quality control. At the end of 20X5, Don requested an analysis of the progress the company had made in reducing and controlling quality costs. The accounting department assembled the following data: Required: 1. Compute the quality costs as a percentage of sales by category and in total for each year. 2. Prepare a multiple-year trend graph for quality costs, both by total costs and by category. Using the graph, assess the progress made in reducing and controlling quality costs. Does the graph provide evidence that quality has improved? Explain. 3. Using the 20X1 quality cost relationships (assume all costs are variable), calculate the quality costs that would have prevailed in 20X4. By how much did profits increase in 20X4 because of the quality improvement program? Repeat for 20X5.arrow_forwardIn 2011, Milton Thayne, president of Carbondale Electronics, received a report indicating that quality costs were 31 percent of sales. Faced with increasing pressures from imported goods, Milton resolved to take measures to improve the overall quality of the companys products. After hiring a consultant in 20x0, the company began an aggressive program of total quality control. At the end of 20x5, Milton requested an analysis of the progress the company had made in reducing and controlling quality costs. The Accounting Department assembled the following data: Required: 1. Compute the quality costs as a percentage of sales by category and in total for each year. 2. Prepare a multiple-year trend graph for quality costs, both by total costs and by category. Using the graph, assess the progress made in reducing and controlling quality costs. Does the graph provide evidence that quality has improved? Explain. 3. Using the 20x1 quality cost relationships (assume all costs are variable), calculate the quality costs that would have prevailed in 20x4. By how much did profits increase in 20x4 because of the quality improvement program? Repeat for 20x5.arrow_forwardIn 20x5, Major Company initiated a full-scale, quality improvement program. At the end of the year, Jack Aldredge, the president, noted with some satisfaction that the defects per unit of product had dropped significantly compared to the prior year. He was also pleased that relationships with suppliers had improved and defective materials had declined. The new quality training program was also well accepted by employees. Of most interest to the president, however, was the impact of the quality improvements on profitability. To help assess the dollar impact of the quality improvements, the actual sales and the actual quality costs for 20x4 and 20x5 are as follows by quality category: All prevention costs are fixed (by discretion). Assume all other quality costs are unit-level variable. Required: 1. Compute the relative distribution of quality costs for each year and prepare a pie chart. Do you believe that the company is moving in the right direction in terms of the balance among the quality cost categories? Explain. 2. Prepare a one-year trend performance report for 20x5 (compare the actual costs of 20x5 with those of 20x4, adjusted for differences in sales volume). How much have profits increased because of the quality improvements made by Major Company? 3. Estimate the additional improvement in profits if Major Company ultimately reduces its quality costs to 2.5 percent of sales revenues (assume sales of 10 million).arrow_forward
- Recently, Ulrich Company received a report from an external consulting group on its quality costs. The consultants reported that the companys quality costs total about 21 percent of its sales revenues. Somewhat shocked by the magnitude of the costs, Rob Rustin, president of Ulrich Company, decided to launch a major quality improvement program. For the coming year, management decided to reduce quality costs to 17 percent of sales revenues. Although the amount of reduction was ambitious, most company officials believed that the goal could be realized. To improve the monitoring of the quality improvement program, Rob directed Pamela Golding, the controller, to prepare monthly performance reports comparing budgeted and actual quality costs. Budgeted costs and sales for the first two months of the year are as follows: The following actual sales and actual quality costs were reported for January: Required: 1. Reorganize the monthly budgets so that quality costs are grouped in one of four categories: appraisal, prevention, internal failure, or external failure. (Essentially, prepare a budgeted cost of quality report.) Also, identify each cost as variable (V) or fixed (F). (Assume that no costs are mixed.) 2. Prepare a performance report for January that compares actual costs with budgeted costs. Comment on the companys progress in improving quality and reducing its quality costs.arrow_forwardMaxwell Company produces a variety of kitchen appliances, including cooking ranges and dishwashers. Over the past several years, competition has intensified. In order to maintainand perhaps increaseits market share, Maxwells management decided that the overall quality of its products had to be increased. Furthermore, costs needed to be reduced so that the selling prices of its products could be reduced. After some investigation, Maxwell concluded that many of its problems could be traced to the unreliability of the parts that were purchased from outside suppliers. Many of these components failed to work as intended, causing performance problems. Over the years, the company had increased its inspection activity of the final products. If a problem could be detected internally, then it was usually possible to rework the appliance so that the desired performance was achieved. Management also had increased its warranty coverage; warranty work had been increasing over the years. David Haight, president of Maxwell Company, called a meeting with his executive committee. Lee Linsenmeyer, chief engineer; Kit Applegate, controller; and Jeannie Mitchell, purchasing manager, were all in attendance. How to improve the companys competitive position was the meetings topic. The conversation of the meeting was recorded as seen on the following page: DAVID: We need to find a way to improve the quality of our products and at the same time reduce costs. Lee, you said that you have done some research in this area. Would you share your findings? LEE: As you know, a major source of our quality problems relates to the poor quality of the parts we acquire from the outside. We have a lot of different parts, and this adds to the complexity of the problem. What I thought would be helpful would be to redesign our products so that they can use as many interchangeable parts as possible. This will cut down the number of different parts, make it easier to inspect, and cheaper to repair when it comes to warranty work. My engineering staff has already come up with some new designs that will do this for us. JEANNIE: I like this idea. It will simplify the purchasing activity significantly. With fewer parts, I can envision some significant savings for my area. Lee has shown me the designs so I know exactly what parts would be needed. I also have a suggestion. We need to embark on a supplier evaluation program. We have too many suppliers. By reducing the number of different parts, we will need fewer suppliers. And we really dont need to use all the suppliers that produce the parts demanded by the new designs. We should pick suppliers that will work with us and provide the quality of parts that we need. I have done some preliminary research and have identified five suppliers that seem willing to work with us and assure us of the quality we need. Lee may need to send some of his engineers into their plants to make sure that they can do what they are claiming. DAVID: This sounds promising. Kit, can you look over the proposals and their estimates and give us some idea if this approach will save us any money? And if so, how much can we expect to save? KIT: Actually, I am ahead of the game here. Lee and Jeannie have both been in contact with me and have provided me with some estimates on how these actions would affect different activities. I have prepared a handout that includes an activity table revealing what I think are the key activities affected. I have also assembled some tentative information about activity costs. The table gives the current demand and the expected demand after the changes are implemented. With this information, we should be able to assess the expected cost savings. Additionally, the following activity cost data are provided: Purchasing parts: Variable activity cost: 30 per part number; 20 salaried clerks, each earning a 45,000 annual salary. Each clerk is capable of processing orders associated with 100 part numbers. Inspecting parts: Twenty-five inspectors, each earning a salary of 40,000 per year. Each inspector is capable of 2,000 hours of inspection. Reworking products: Variable activity cost: 25 per unit reworked (labor and parts). Warranty: Twenty repair agents, each paid a salary of 35,000 per year. Each repair agent is capable of repairing 500 units per year. Variable activity costs: 15 per product repaired. Required: 1. Compute the total savings possible as reflected by Kits handout. Assume that resource spending is reduced where possible. 2. Explain how redesign and supplier evaluation are linked to the savings computed in Requirement 1. Discuss the importance of recognizing and exploiting internal and external linkages. 3. Identify the organizational and operational activities involved in the strategy being considered by Maxwell Company. What is the relationship between organizational and operational activities?arrow_forwardKathy Shorts, president of Oliver Company, was concerned with the trend in sales and profitability. The company had been losing customers at an alarming rate. Furthermore, the company was barely breaking even. Investigation revealed that poor quality was at the root of the problem. At the end of 20x5, Kathy decided to begin a quality improvement program. As a first step, she identified the following costs in the accounting records as quality related: Required: 1. Prepare a quality cost report by quality cost category. 2. Calculate the relative distribution percentages for each quality cost category. Comment on the distribution. 3. Using the Taguchi loss function, an average loss per unit is computed to be 15 per unit. What are the hidden costs of external failure? How does this affect the relative distribution? 4. Shortss quality manager decided not to bother with the hidden costs. What do you think was his reasoning? Any efforts to reduce measured external failure costs will also reduce the hidden costs. Do you agree or disagree? Explain.arrow_forward
- Wright Plastic Products is a small company that specialized in the production of plastic dinner plates until several years ago. Although profits for the company had been good, they have been declining in recent years because of increased competition. Many competitors offer a full range of plastic products, and management felt that this created a competitive disadvantage. The output of the companys plants was exclusively devoted to plastic dinner plates. Three years ago, management made a decision to add additional product lines. They determined that existing idle capacity in each plant could easily be adapted to produce other plastic products. Each plant would produce one additional product line. For example, the Atlanta plant would add a line of plastic cups. Moreover, the variable cost of producing a package of cups (one dozen) was virtually identical to that of a package of plastic plates. (Variable costs referred to here are those that change in total as the units produced change. The costs include direct materials, direct labor, and unit-based variable overhead such as power and other machine costs.) Since the fixed expenses would not change, the new product was forecast to increase profits significantly (for the Atlanta plant). Two years after the addition of the new product line, the profits of the Atlanta plant (as well as other plants) had not improvedin fact, they had dropped. Upon investigation, the president of the company discovered that profits had not increased as expected because the so-called fixed cost pool had increased dramatically. The president interviewed the manager of each support department at the Atlanta plant. Typical responses from four of those managers are given next. Materials handling: The additional batches caused by the cups increased the demand for materials handling. We had to add one forklift and hire additional materials handling labor. Inspection: Inspecting cups is more complicated than plastic plates. We only inspect a sample drawn from every batch, but you need to understand that the number of batches has increased with this new product line. We had to hire more inspection labor. Purchasing: The new line increased the number of purchase orders. We had to use more resources to handle this increased volume. Accounting: There were more transactions to process than before. We had to increase our staff. Required: 1. Explain why the results of adding the new product line were not accurately projected. 2. Could this problem have been avoided with an activity-based cost management system? If so, would you recommend that the company adopt this type of system? Explain and discuss the differences between an activity-based cost management system and a traditional cost management system.arrow_forwardDanna Wise, president of Tidwell Company, recently returned from a conference on quality and productivity. At the conference, she was told that many American firms have quality costs totaling 20 to 30% of sales. The quality experts at the conference convinced her that a company could increase its profitability by improving quality. However, she was of the opinion that the quality of Tidwell Company was much less than 20%probably more in the 4 to 6% range. However, because the potential for increasing profits was so great if she was wrong, she decided to request a preliminary estimate of the total quality costs currently being incurred. She asked her controller for a summary of quality costs, with the costs classified into four categories: prevention, appraisal, internal failure, or external failure. She also wanted the costs expressed as a percentage of both sales and profits. The controller had his staff assemble the following information from the past year, 20X1: a. Sales revenue, 37,240,000; net income, 4,000,000. b. During the year, customers returned 40,000 units needing repair. Repair cost averages 9 per unit. c. Twelve inspectors are employed, each earning an annual salary of 80,000. The inspectors are involved only with final inspection (product acceptance). d. Total scrap is 200,000 units. Of this total, ninety percent is quality related. The cost of scrap is about 10 per unit. e. Each year, approximately 800,000 units are rejected in final inspection. Of these units, seventy-five percent can be recovered through rework. The cost of rework is 1.80 per I unit. f. A customer cancelled an order that would have increased profits by 600,000. The customers reason for cancellation was poor product performance. g. The company employs 10 full-time employees in its complaint department. Each earns 48,600 a year. h. The company gave sales allowances totaling 180,000 due to substandard products being sent to the customer. i. The company requires all new employees to take its 4-hour quality training program. The estimated annual cost of the program is 120,000. Required: 1. Prepare a simple quality cost report classifying costs by category. 2. Compute the quality cost-sales ratio. Also, compare the total quality costs with total profits. Should Danna be concerned with the level of quality costs? 3. Prepare a pie chart for the quality costs. Discuss the distribution of quality costs among the four categories. Are they properly distributed? Explain. 4. Discuss how the company can improve its overall quality and at the same time reduce total quality costs. 5. By how much will profits increase if quality costs are reduced to 3% of sales?arrow_forwardSuppose that Kicker had the following sales and cost experience (in thousands of dollars) for May of the current year and for May of the prior year: In May of the prior year, Kicker started an intensive quality program designed to enable it to build original equipment manufacture (OEM) speaker systems for a major automobile company. The program was housed in research and development. In the beginning of the current year, Kickers accounting department exercised tighter control over sales commissions, ensuring that no dubious (e.g., double) payments were made. The increased sales in the current year required additional warehouse space that Kicker rented in town. (Round ratios to four decimal places. Round sales dollars computations to the nearest dollar.) Required: 1. Calculate the contribution margin ratio for May of both years. 2. Calculate the break-even point in sales dollars for both years. 3. Calculate the margin of safety in sales dollars for both years. 4. CONCEPTUAL CONNECTION Analyze the differences shown by your calculations in Requirements 1, 2, and 3.arrow_forward
- At the end of 20x1, Mejorar Company implemented a low-cost strategy to improve its competitive position. Its objective was to become the low-cost producer in its industry. A Balanced Scorecard was developed to guide the company toward this objective. To lower costs, Mejorar undertook a number of improvement activities such as JIT production, total quality management, and activity-based management. Now, after two years of operation, the president of Mejorar wants some assessment of the achievements. To help provide this assessment, the following information on one product has been gathered: Required: 1. Compute the following measures for 20x1 and 20x3: a. Actual velocity and cycle time b. Percentage of total revenue from new customers (assume one unit per customer) c. Percentage of very satisfied customers (assume each customer purchases one unit) d. Market share e. Percentage change in actual product cost (for 20x3 only) f. Percentage change in days of inventory (for 20x3 only) g. Defective units as a percentage of total units produced h. Total hours of training i. Suggestions per production worker j. Total revenue k. Number of new customers 2. For the measures listed in Requirement 1, list likely strategic objectives, classified according to the four Balance Scorecard perspectives. Assume there is one measure per objective.arrow_forwardBannister Company, an electronics firm, buys circuit boards and manually inserts various electronic devices into the printed circuit board. Bannister sells its products to original equipment manufacturers. Profits for the last two years have been less than expected. Mandy Confer, owner of Bannister, was convinced that her firm needed to adopt a revenue growth and cost reduction strategy to increase overall profits. After a careful review of her firms condition, Mandy realized that the main obstacle for increasing revenues and reducing costs was the high defect rate of her products (a 6 percent reject rate). She was certain that revenues would grow if the defect rate was reduced dramatically. Costs would also decline as there would be fewer rejects and less rework. By decreasing the defect rate, customer satisfaction would increase, causing, in turn, an increase in market share. Mandy also felt that the following actions were needed to help ensure the success of the revenue growth and cost reduction strategy: a. Improve the soldering capabilities by sending employees to an outside course. b. Redesign the insertion process to eliminate some of the common mistakes. c. Improve the procurement process by selecting suppliers that provide higher-quality circuit boards. Required: 1. State the revenue growth and cost reduction strategy using a series of cause-and-effect relationships expressed as if-then statements. 2. Illustrate the strategy using a strategy map. 3. Explain how the revenue growth strategy can be tested. In your explanation, discuss the role of lead and lag measures, targets, and double-loop feedback.arrow_forwardPosavek is a wholesale supplier of building supplies building contractors, hardware stores, and home-improvement centers in the Boston metropolitan area. Over the years, Posavek has expanded its operations to serve customers across the nation and now employs over 200 people as technical representatives, buyers, warehouse workers, and sales and office staff. Most recently, Posavek has experienced fierce competition from the large online discount stores. In addition, the company is suffering from operational inefficiencies related to its archaic information system. Posavek revenue cycle procedures are described in the following paragraphs. Revenue Cycle Posaveks sales department representatives receive orders via traditional mail, e-mail, telephone, and the occasional walk-in customer. Because Posavek is a wholesaler, the vast majority of its business is conducted on a credit basis. The process begins in the sales department, where the sales clerk enters the customers order into the centralized computer sales order system. The computer and file server are housed in Posaveks small data processing department. If the customer has done business with Posavek in the past, his or her data are already on file. If the customer is a first-time buyer, however, the clerk creates a new record in the customer account file. The system then creates a record of the transaction in the open sales order file. When the order is entered, an electronic copy of it is sent to the customers e-mail address as confirmation. A clerk in the warehouse department periodically reviews the open sales order file from a terminal and prints two copies of a stock release document for each new sale, which he uses to pick the items sold from the shelves. The warehouse clerk sends one copy of the stock release to the sales department and the second copy, along with the goods, to the shipping department. The warehouse clerk then updates the inventory subsidiary file to reflect the items and quantities shipped. Upon receipt of the stock release document, the sales clerk accesses the open sales order file from a terminal, closes the sales order, and files the stock release document in the sales department. The sales order system automatically posts these transactions to the sales, inventory control, and cost-of-goods-sold accounts in the general ledger file. Upon receipt of the goods and the stock release, the shipping department clerk prepares the goods for shipment to the customer. The clerk prepares three copies of the bill of lading. Two of these go with the goods to the carrier and the third, along with the stock release document, is filed in the shipping department. The billing department clerk reviews the closed sales orders from a terminal and prepares two copies of the sales invoice. One copy is mailed to the customer, and the other is filed in the billing department. The clerk then creates a new record in the accounts receivable subsidiary file. The sales order system automatically updates the accounts receivable control account in the general ledger file. CASH RECEIPTS PROCEDURES Mail room clerks open customer cash receipts, reviews the check and remittance advices for completeness, and prepares two copies of a remittance list. One copy is sent with the checks to the cash receipts department. The second copy of the remittance advices are sent to the billing department. When the cash receipts clerk receives the checks and remittance list, he verifies the checks received against those on the remittance list and signs the checks For Deposit Only. Once the checks are endorsed, he records the receipts in the cash receipts journal from his terminal. The clerk then fills out a deposit slip and deposits the checks in the bank. Upon receipt of the remittances, the billing department clerk records the amounts in the accounts receivable subsidiary ledger from the department terminal. The system automatically updates the AR control account in the general ledger Posavek has hired your public accounting firm to review its sales order procedures for internal control compliance and to make recommendations for changes. Required a. Create a data flow diagram of the current system. b. Create a system flowchart of the existing system. c. Analyze the physical internal control weaknesses in the system. d. (Optional) Prepare a system flowchart of a redesigned computer-based system that resolves the control weaknesses that you identified. Explain your solution.arrow_forward
 Managerial Accounting: The Cornerstone of Busines...AccountingISBN:9781337115773Author:Maryanne M. Mowen, Don R. Hansen, Dan L. HeitgerPublisher:Cengage Learning
 Cornerstones of Cost Management (Cornerstones Ser...AccountingISBN:9781305970663Author:Don R. Hansen, Maryanne M. MowenPublisher:Cengage Learning
 Managerial AccountingAccountingISBN:9781337912020Author:Carl Warren, Ph.d. Cma William B. TaylerPublisher:South-Western College Pub
 Principles of Accounting Volume 2AccountingISBN:9781947172609Author:OpenStaxPublisher:OpenStax College
 Accounting Information SystemsAccountingISBN:9781337619202Author:Hall, James A.Publisher:Cengage Learning,