
Concept explainers
Videos
a.
Estimate the proportion of adults who view a landline phone as a necessity using 95% confidence interval.
a.
Answer to Problem 5CRE
The 95% confidence interval of the proportion of adults who view a landline phone as a necessity is (0.6511, 0.7089).
Explanation of Solution
It is given that out of 1,003 adults, 68% thought a landline phone was a necessity.
Here, the sample size,
Conditions for 95% confidence interval:
1. Values of
Since
2. The sample size
3. Since it is given that the survey is nationally representative, it is reasonable to assume the sample as a random sample from the population of adults.
Calculation:
The 95% confidence interval for p is given below.
Substitute the values of
Interpretation:
The 95% confidence interval of the proportion of adults who view a landline phone as a necessity is (0.6511, 0.7089). Therefore, one can be 95% confident that the proportion of all adults who view a landline phone as a necessity is between 0.6511 and 0.7089.
b.
Check whether there is any convincing evidence that a majority of adults view a television set as a necessity at 0.05 significance level.
b.
Answer to Problem 5CRE
There is no convincing evidence that a majority of adults consider a TV set as necessity.
Explanation of Solution
In order to test majority of adults view a television set as a necessity, population proportion test is appropriate.
The following nine steps carry out the test for proportions.
1. Population characteristic of interest:
Let
2. Null hypothesis:
That is, the proportion of adults who view a television set as a necessity is 0.5.
3. Alternative hypothesis:
That is, the proportion of adults who view a television set as a necessity is greater than 0.5.
That is, majority of adults consider a TV set as necessity.
4. Significance level:
5. Test statistic:
6. Assumptions:
- Here,
- The sample is nationally representative. Hence, the sample can be treated as a random sample from the population.
- The sample size of 1,003 is large enough. Hence, all assumptions satisfy to conduct large sample test.
7. Calculation:
It is given that 52% (= 0.52) said they viewed a television set as a necessity. Therefore,
8. P-value:
Software procedure:
Step-by-step procedure to find P-value using MINITAB software:
- Select Graph > Probability Distribution Plots.
- Choose View Probability.
- In Distribution, select Normal under Distribution.
- In Shaded Area, choose Right tail and give X value as 1.267.
- Click OK.
The MINITAB output is as follows:
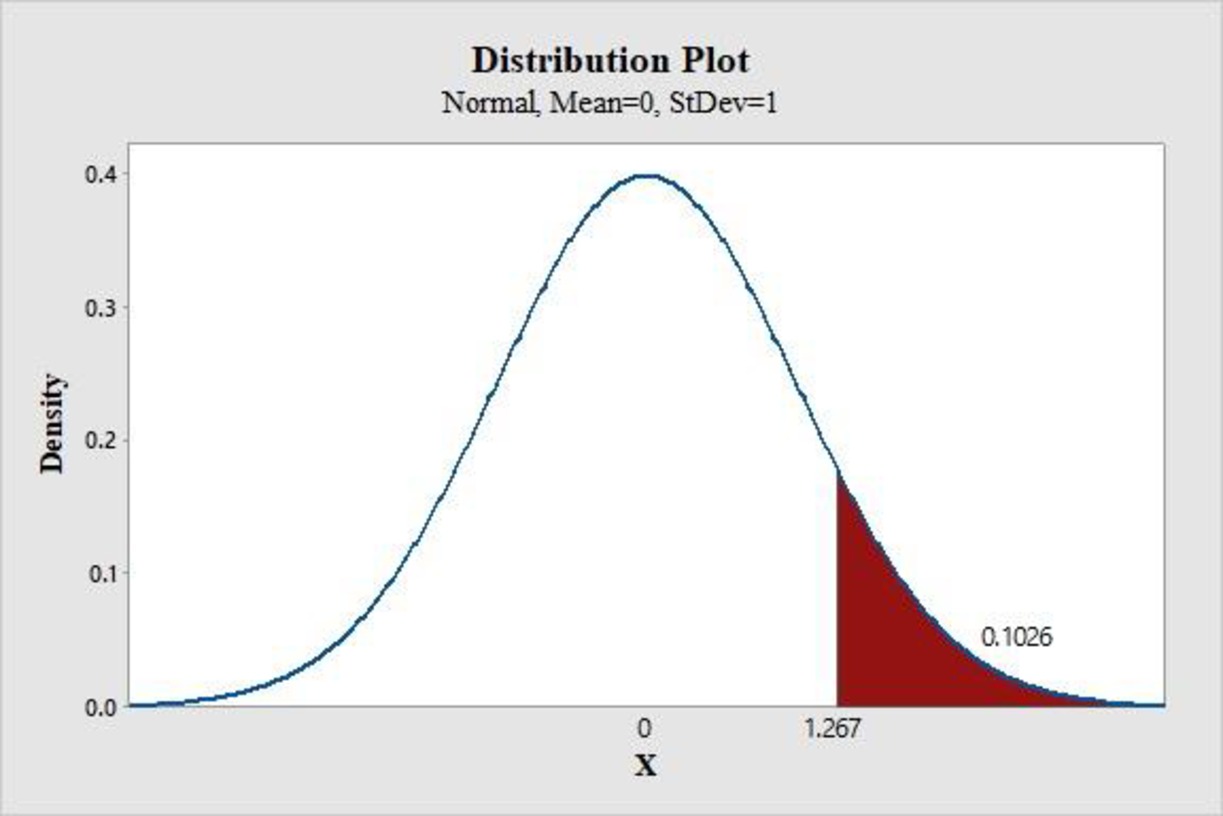
From the MINITAB output, the P-value is 0.1026.
9. Conclusion:
Decision Rule:
If P-value is less than significance level, reject H0.
Here the significance level is 0.05.
Hence,
Since P-value is greater than 0.05, fail to reject the null hypothesis. Therefore, there is no convincing evidence that a majority of adults consider a TV set as necessity.
c.
Check whether there is any convincing evidence that the proportion of adults who regard a microwave oven as a necessity decreased between 2003 and 2009 at 0.01 significance level.
c.
Answer to Problem 5CRE
There is a convincing evidence that the proportion of adults who regarded a microwave oven as a necessity decreased between 2003 and 2009.
Explanation of Solution
In order to test the proportion of adults who regard a microwave oven as a necessity decreased between 2003 and 2009, population proportion test is appropriate.
The following nine steps carry out the test for proportions.
1. Population characteristic of interest:
Let
2. Null hypothesis:
That is, the proportions of adults who regarded a microwave oven as a necessity in 2003 and 2009 are equal.
3. Alternative hypothesis:
That is, the proportion of adults who regarded a microwave oven as a necessity in 2003 is greater than the proportion of adults who regarded a microwave oven as a necessity in 2009.
4. Significance level:
5. Test statistic:
Where,
6. Assumptions:
Here,
- Since the values of
- Also, the sample is nationally representative. Hence, the samples can be treated as a random sample from the population.
- The sample size of 1,003 is large enough. Hence, all assumptions satisfy to conduct large sample test.
7. Calculation:
It is given that 68% of the 2003 sample regarded a microwave oven as a necessity and 47% of the 2009 sample regarded a microwave oven as a necessity.
8. P-value:
Software procedure:
Step-by-step procedure to find P-value using MINITAB software:
- Select Graph > Probability Distribution Plots.
- Choose View Probability.
- In Distribution, select Normal under Distribution.
- In Shaded Area, choose left tail and give X value as 9.5132.
- Click OK.
The MINITAB output is as follows:
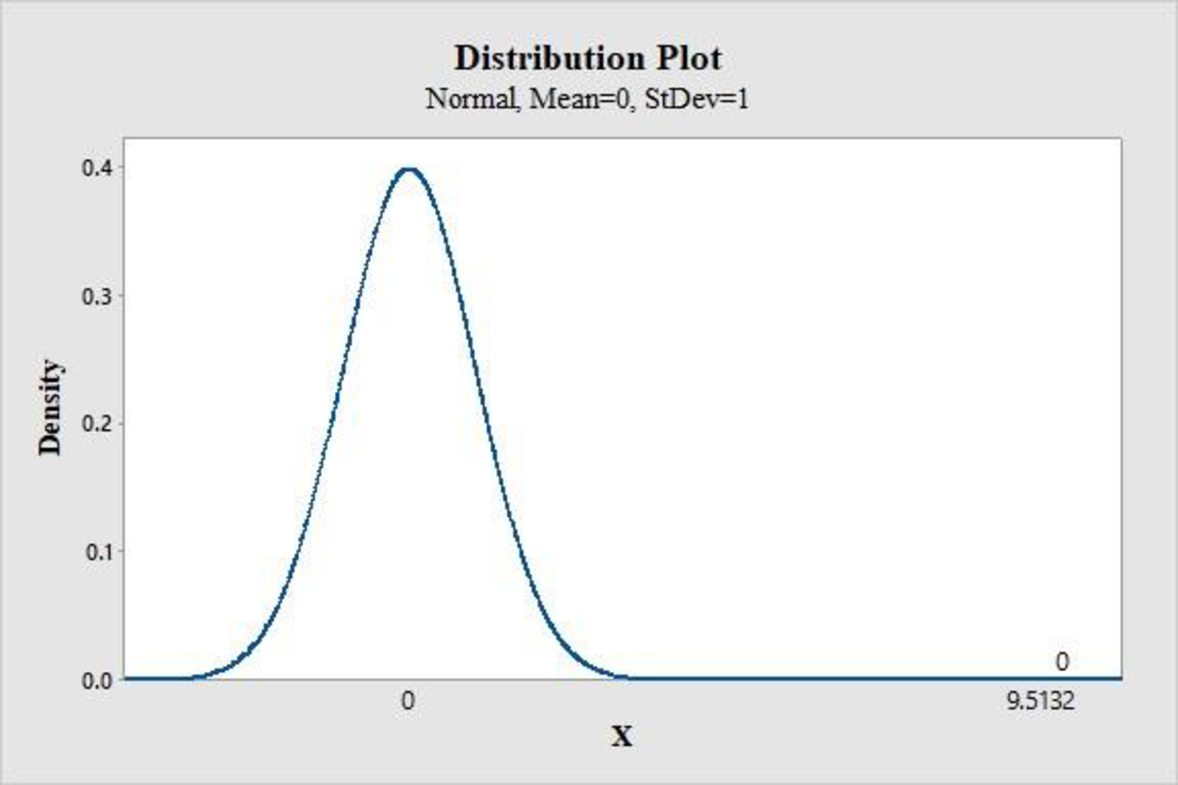
From the MINITAB output, the P-value is 0.000.
9. Conclusion:
Decision Rule:
If P-value is less than significance level, reject H0. Otherwise, fail to reject
Here, the significance level is 0.01.
Here, the P-value is less than the level of significance.
Hence,
Since P-value is less than 0.01, reject the null hypothesis. Therefore, there is convincing evidence that the proportion of adults who regarded a microwave oven as a necessity decreased between 2003 and 2009.
Want to see more full solutions like this?
Chapter 13 Solutions
INTRODUCTION TO STATISTICS & DATA ANALYS


 Holt Mcdougal Larson Pre-algebra: Student Edition...AlgebraISBN:9780547587776Author:HOLT MCDOUGALPublisher:HOLT MCDOUGAL
 Big Ideas Math A Bridge To Success Algebra 1: Stu...AlgebraISBN:9781680331141Author:HOUGHTON MIFFLIN HARCOURTPublisher:Houghton Mifflin Harcourt
 Glencoe Algebra 1, Student Edition, 9780079039897...AlgebraISBN:9780079039897Author:CarterPublisher:McGraw Hill
 College Algebra (MindTap Course List)AlgebraISBN:9781305652231Author:R. David Gustafson, Jeff HughesPublisher:Cengage Learning