
INTRODUCTION TO STATISTICS & DATA ANALYS
6th Edition
ISBN: 9780357420447
Author: PECK
Publisher: CENGAGE L
expand_more
expand_more
format_list_bulleted
Videos
Textbook Question
Chapter 13.4, Problem 46E
For the cereal data of the previous exercise, the
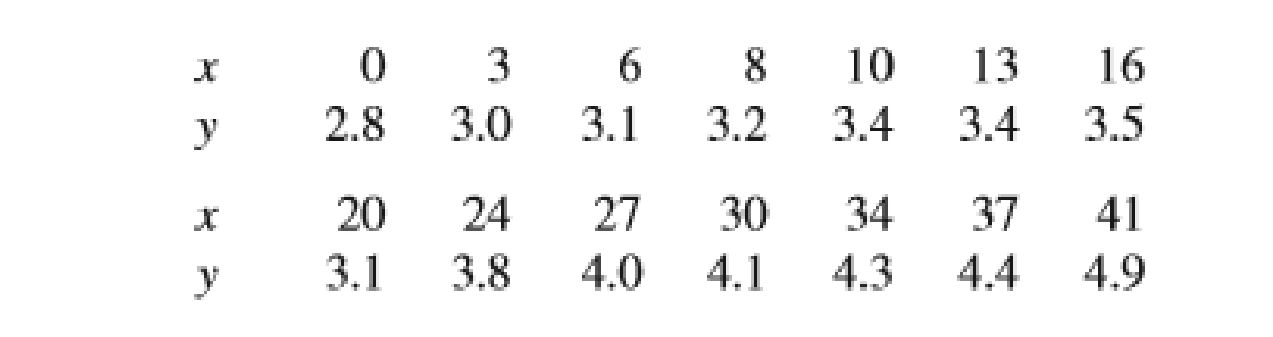
13.45 The shelf life of packaged food depends on many factors. Dry cereal is considered to be a moisture-sensitive product (no one likes soggy cereal!) with the shelf life determined primarily by moisture content. In a study of the shelf life of one particular brand of cereal, x = Time on shelf (days stored at 73°F and 50% relative humidity) and y = Moisture content (%) were recorded. The resulting data are from “Computer Simulation Speeds Shelf Life Assessments” (Package Engineering [1983]: 72–73).
Expert Solution & Answer
Want to see the full answer?
Check out a sample textbook solution
Students have asked these similar questions
A medical doctor who wanted to study the heights of adult men and women took a random sample of 150 adult men and 120 adult women and found the following summary results. Mean Height Standard Deviation Adult Men 170cm 8cm Adult Women 164cm 6cm Find a 90% confidence interval for the difference of mean height of adult men and women.
The results of the National Health and Nutrition Examination Survey for the year 2011-12 found that 12.9% of the adults of age 20 and more in the United States had high total cholesterol.
Assume that a researcher surveys a sample size of 120 for above 20 years. Construct a 95% confidence interval estimate for the population proportion so that the cholesterol level is the same as 12.9% (PHStat).
Assume that a researcher surveys a sample size of 1,200 for more than 20 years. Construct a 95% confidence interval estimate for the population proportion so that the cholesterol level is the same as 12.9%.(PHStat)
Compare the results in (a) and (b).
1. What is the mean BMI of this population?
2. How do these adults’ BMI value stack up against the rest of the country?
3. Nationally, 47% of adults in the US have hypertension (see the CDC article for more
details). Does this population have a significantly lower percentage of adults with
hypertension? Use 0.01.
Use your sample to create a 95% confidence interval for the mean BMI value
of this population.
Based on your confidence interval, compare the BIM of these adults with the
national mean of 26.55 mean.
Include a brief written report that includes complete demonstrations of the
statistical procedures you used and your conclusions for questions 1-2
Determine whether your sample provides statistical evidence that
this company’s population of adults have a lower rate of
Hypertension than the national average. Set alpha at 0.01.
Chapter 13 Solutions
INTRODUCTION TO STATISTICS & DATA ANALYS
Ch. 13.1 - Let x be the size of a house (in square feet) and...Ch. 13.1 - Consider the variables and population regression...Ch. 13.1 - The flow rate in a device used for air quality...Ch. 13.1 - The paper Predicting Yolk Height, Yolk Width,...Ch. 13.1 - A sample of small cars was selected, and the...Ch. 13.1 - Prob. 6ECh. 13.1 - Suppose that a simple linear regression model is...Ch. 13.1 - a. Explain the difference between the line y x...Ch. 13.1 - Prob. 9ECh. 13.1 - Hormone replacement therapy (HRT) is thought to...
Ch. 13.1 - Consider the data and estimated regression line...Ch. 13.1 - A simple linear regression model was used to...Ch. 13.1 - Consider the accompanying data on x = Advertising...Ch. 13.2 - What is the difference between and b? What is the...Ch. 13.2 - The largest commercial fishing enterprise in the...Ch. 13.2 - Prob. 16ECh. 13.2 - Prob. 17ECh. 13.2 - Prob. 18ECh. 13.2 - An experiment to study the relationship between x...Ch. 13.2 - The paper The Effects of Split Keyboard Geometry...Ch. 13.2 - The authors of the paper Decreased Brain Volume in...Ch. 13.2 - Do taller adults make more money? The authors of...Ch. 13.2 - Researchers studying pleasant touch sensations...Ch. 13.2 - Prob. 24ECh. 13.2 - Acrylamide is a chemical that is sometimes found...Ch. 13.2 - Prob. 26ECh. 13.2 - Exercise 13.18 described a regression analysis...Ch. 13.2 - Consider the accompanying data on x = Research and...Ch. 13.2 - Prob. 29ECh. 13.2 - In anthropological studies, an important...Ch. 13.3 - The graphs accompanying this exercise are based on...Ch. 13.3 - Prob. 32ECh. 13.3 - Prob. 33ECh. 13.3 - The article Vital Dimensions in Volume Perception:...Ch. 13.3 - Prob. 35ECh. 13.3 - An investigation of the relationship between x =...Ch. 13.4 - Prob. 37ECh. 13.4 - Prob. 38ECh. 13.4 - In Exercise 13.19, we considered a regression of y...Ch. 13.4 - Prob. 40ECh. 13.4 - A subset of data read from a graph that appeared...Ch. 13.4 - Prob. 42ECh. 13.4 - Prob. 43ECh. 13.4 - The article first introduced in Exercise 13.34 of...Ch. 13.4 - The shelf life of packaged food depends on many...Ch. 13.4 - For the cereal data of the previous exercise, the...Ch. 13.4 - The article Performance Test Conducted for a Gas...Ch. 13.5 - Prob. 48ECh. 13.5 - Prob. 49ECh. 13.5 - A sample of n = 353 college faculty members was...Ch. 13.5 - Prob. 51ECh. 13.5 - Prob. 52ECh. 13.5 - The accompanying summary quantities for x =...Ch. 13.5 - Prob. 54ECh. 13.5 - Prob. 55ECh. 13.6 - Prob. 56ECh. 13 - Prob. 1CRECh. 13 - Prob. 2CRECh. 13 - Prob. 3CRECh. 13 - Prob. 4CRECh. 13 - Prob. 5CRECh. 13 - The accompanying graphical display is similar to...Ch. 13 - Prob. 7CRECh. 13 - Prob. 8CRECh. 13 - Consider the following data on y = Number of songs...Ch. 13 - Many people take ginkgo supplements advertised to...Ch. 13 - Prob. 11CRECh. 13 - Prob. 12CRECh. 13 - Prob. 13CRECh. 13 - Prob. 14CRECh. 13 - The discharge of industrial wastewater into rivers...Ch. 13 - Many people take ginkgo supplements advertised to...Ch. 13 - It is hypothesized that when homing pigeons are...Ch. 13 - Prob. 18CRECh. 13 - Prob. 57CRCh. 13 - Prob. 58CRCh. 13 - Prob. 59CRCh. 13 - The article Photocharge Effects in Dye Sensitized...Ch. 13 - Prob. 61CRCh. 13 - Prob. 62CRCh. 13 - Prob. 63CRCh. 13 - Prob. 64CRCh. 13 - Prob. 65CRCh. 13 - The article Improving Fermentation Productivity...Ch. 13 - Prob. 67CRCh. 13 - Prob. 68CRCh. 13 - Prob. 69CR
Knowledge Booster


Learn more about
Need a deep-dive on the concept behind this application? Look no further. Learn more about this topic, statistics and related others by exploring similar questions and additional content below.Similar questions
- In a study to measure the effect of an herbicide on the phosphate content of bean plants, asample of 75 plants treated with the herbicide had a mean phosphate concentration (in percent)of 3.52 and a standard deviation of 0.41, and 100 untreated plants had a mean phosphateconcentration of 5.82 with a standard deviation of 0.52.a) Construct a 98% confidence interval for the difference in mean phosphate concentrationbetween the treated plants and the untreated plants.b) Does it appear that the treatment is useful in reducing the phosphate concentration in beanplants? Explain.arrow_forwardA certain article indicates that in a sample of 1,000 dog owners, 620 said that they take more pictures of their dog than their significant others or friends. In addition, 470 said that they are more likely to complain to their dog than to a friend. Suppose that it is reasonable to consider this sample as representative of the population of dog owners. (a) Construct a 90% confidence interval for the proportion of dog owners who take more pictures of their dog than of their significant others or friends. (Round your answers to three decimal places.) ( , ) Interpret the interval choose one. a. We are 90% confident that the mean number of dog owners who take more pictures of their dog than of their significant others or friends falls within this interval. b. There is a 90% chance that the true proportion of dog owners who take more pictures of their dog than of their significant others or friends falls within this interval. c. There is a 90% chance…arrow_forwarda. The average IQ is 100, with a population standard deviation of 15. The mayor of Smartsville claims that citizens in his town have higher than average IQs. To test that claim, 40 Smartsville citizens were randomly selected, and their average IQ was determined to be 104.1. Does this support the mayor’s claim? Use α = 0.1. b. construct a 90 % confidence interval for the mean. Does the confidence interval support the claim made in part a?arrow_forward
arrow_back_ios
arrow_forward_ios
Recommended textbooks for you
 MATLAB: An Introduction with ApplicationsStatisticsISBN:9781119256830Author:Amos GilatPublisher:John Wiley & Sons Inc
 Probability and Statistics for Engineering and th...StatisticsISBN:9781305251809Author:Jay L. DevorePublisher:Cengage Learning
 Statistics for The Behavioral Sciences (MindTap C...StatisticsISBN:9781305504912Author:Frederick J Gravetter, Larry B. WallnauPublisher:Cengage Learning
 Elementary Statistics: Picturing the World (7th E...StatisticsISBN:9780134683416Author:Ron Larson, Betsy FarberPublisher:PEARSON
 The Basic Practice of StatisticsStatisticsISBN:9781319042578Author:David S. Moore, William I. Notz, Michael A. FlignerPublisher:W. H. Freeman
 Introduction to the Practice of StatisticsStatisticsISBN:9781319013387Author:David S. Moore, George P. McCabe, Bruce A. CraigPublisher:W. H. Freeman
MATLAB: An Introduction with Applications
Statistics
ISBN:9781119256830
Author:Amos Gilat
Publisher:John Wiley & Sons Inc
Probability and Statistics for Engineering and th...
Statistics
ISBN:9781305251809
Author:Jay L. Devore
Publisher:Cengage Learning
Statistics for The Behavioral Sciences (MindTap C...
Statistics
ISBN:9781305504912
Author:Frederick J Gravetter, Larry B. Wallnau
Publisher:Cengage Learning
Elementary Statistics: Picturing the World (7th E...
Statistics
ISBN:9780134683416
Author:Ron Larson, Betsy Farber
Publisher:PEARSON
The Basic Practice of Statistics
Statistics
ISBN:9781319042578
Author:David S. Moore, William I. Notz, Michael A. Fligner
Publisher:W. H. Freeman
Introduction to the Practice of Statistics
Statistics
ISBN:9781319013387
Author:David S. Moore, George P. McCabe, Bruce A. Craig
Publisher:W. H. Freeman
Hypothesis Testing using Confidence Interval Approach; Author: BUM2413 Applied Statistics UMP;https://www.youtube.com/watch?v=Hq1l3e9pLyY;License: Standard YouTube License, CC-BY
Hypothesis Testing - Difference of Two Means - Student's -Distribution & Normal Distribution; Author: The Organic Chemistry Tutor;https://www.youtube.com/watch?v=UcZwyzwWU7o;License: Standard Youtube License