
EBK STATISTICAL TECHNIQUES IN BUSINESS
17th Edition
ISBN: 9781259924163
Author: Lind
Publisher: MCGRAW HILL BOOK COMPANY
expand_more
expand_more
format_list_bulleted
Concept explainers
Videos
Textbook Question
Chapter 14, Problem 22CE
A regional planner is studying the demographics of nine counties in the eastern region of an Atlantic seaboard state. She has gathered the following data:
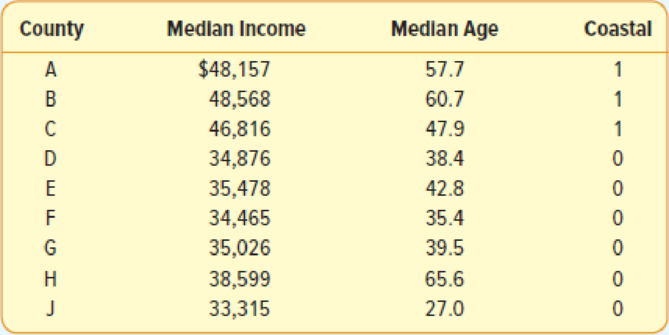
- a. Is there a linear relationship between the median income and median age?
- b. Which variable is the “dependent” variable?
- c. Use statistical software to determine the regression equation. Interpret the value of the slope in a simple regression equation.
- d. Include the aspect that the county is “coastal” or not in a multiple linear
regression analysis using a “dummy” variable. Does it appear to be a significant influence on incomes? - e. Test each of the individual coefficients to see if they are significant.
- f. Make a plot of the residuals and comment on whether they appear to follow a
normal distribution. - g. Plot the residuals versus the fitted values. Do they seem to have the same amount of variation?
Expert Solution & Answer
Want to see the full answer?
Check out a sample textbook solution
Students have asked these similar questions
Write a sentence to explain the meaning of the standard error of the slope of the regression line,
SEb1=1.581, and the corresponding P-value.
Suppose that a kitchen cabinet warehouse company would like to be able to predict the area of a customer’s kitchen using the number of cabinets and the kitchen ceiling height. To do so data is collected on the following variables from a random sample of customers:
Area – area of the kitchen in square feet
Height – ceiling height in the kitchen (from floor to ceiling) in inches
Cabinets – number of cabinets in the kitchen
Suppose that a multiple linear regression model was fit to the data and that the following output resulted:
Coefficients:
(Intercept)HeightCabinets
Estimate-57.98771.2760.3393
Std. Error8.63820.26430.1302
t value -6.7134.8282.607
Pr(>|t|)2.75e-074.44e-050.0145
What is the predicted area of a kitchen with a height of 96 inches and 10 cabinets? Report your answer to 1 decimal place.
square feet
Suppose that a kitchen cabinet warehouse company would like to be able to predict the area of a customer’s kitchen using the number of cabinets and the kitchen ceiling height. To do so data is collected on the following variables from a random sample of customers:
Area – area of the kitchen in square feet
Height – ceiling height in the kitchen (from floor to ceiling) in inches
Cabinets – number of cabinets in the kitchen
Suppose that a multiple linear regression model was fit to the data and that the following output resulted:
Coefficients:
(Intercept)HeightCabinets
Estimate-57.98771.2760.3393
Std. Error8.63820.26430.1302
t value -6.7134.8282.607
Pr(>|t|)2.75e-074.44e-050.0145
10
Question 10
This is not a form; we suggest that you use the browse mode and read all parts of the question carefully.
Which of the following is the correct interpretation of the coefficient for Cabinets?
For a kitchen with a given ceiling height, the average number of cabinets…
Chapter 14 Solutions
EBK STATISTICAL TECHNIQUES IN BUSINESS
Ch. 14 - There are many restaurants in northeastern South...Ch. 14 - The director of marketing at Reeves Wholesale...Ch. 14 - Thompson Photo Works purchased several new, highly...Ch. 14 - A consulting group was hired by the Human...Ch. 14 - Cellulon, a manufacturer of home insulation, wants...Ch. 14 - Refer to Self-Review 141 on the subject of...Ch. 14 - Prob. 5ECh. 14 - Prob. 6ECh. 14 - Prob. 3SRCh. 14 - Given the following regression output, answer the...
Ch. 14 - The following regression output was obtained from...Ch. 14 - A study by the American Realtors Association...Ch. 14 - The manager of High Point Sofa and Chair, a large...Ch. 14 - Prob. 10ECh. 14 - Prob. 11ECh. 14 - A real estate developer wishes to study the...Ch. 14 - Prob. 13CECh. 14 - Prob. 14CECh. 14 - Prob. 15CECh. 14 - Prob. 16CECh. 14 - The district manager of Jasons, a large discount...Ch. 14 - Suppose that the sales manager of a large...Ch. 14 - The administrator of a new paralegal program at...Ch. 14 - Prob. 20CECh. 14 - Prob. 21CECh. 14 - A regional planner is studying the demographics of...Ch. 14 - Great Plains Distributors, Inc. sells roofing and...Ch. 14 - Prob. 24CECh. 14 - Prob. 25CECh. 14 - Prob. 26CECh. 14 - An investment advisor is studying the relationship...Ch. 14 - Prob. 28CECh. 14 - Prob. 29CECh. 14 - The director of special events for Sun City...Ch. 14 - Prob. 31CECh. 14 - Prob. 32CECh. 14 - Prob. 33DACh. 14 - Prob. 34DACh. 14 - Prob. 35DACh. 14 - Prob. 1PCh. 14 - Quick-print firms in a large downtown business...Ch. 14 - The following ANOVA output is given. a. Compute...Ch. 14 - Prob. 1CCh. 14 - Prob. 2CCh. 14 - Prob. 3CCh. 14 - In a scatter diagram, the dependent variable is...Ch. 14 - What level of measurement is required to compute...Ch. 14 - If there is no correlation between two variables,...Ch. 14 - Which of the following values indicates the...Ch. 14 - Under what conditions will the coefficient of...Ch. 14 - Given the following regression equation, = 7 ...Ch. 14 - Given the following regression equation, = 7 ...Ch. 14 - Given the following regression equation, = 7 ...Ch. 14 - Prob. 1.9PTCh. 14 - In a multiple regression equation, what is the...Ch. 14 - Prob. 1.11PTCh. 14 - Prob. 1.12PTCh. 14 - For a dummy variable, such as gender, how many...Ch. 14 - What is the term given to a table that shows all...Ch. 14 - If there is a linear relationship between the...Ch. 14 - Given the following regression analysis output: a....Ch. 14 - Given the following regression analysis output. a....
Knowledge Booster


Learn more about
Need a deep-dive on the concept behind this application? Look no further. Learn more about this topic, statistics and related others by exploring similar questions and additional content below.Similar questions
- Life Expectancy The following table shows the average life expectancy, in years, of a child born in the given year42 Life expectancy 2005 77.6 2007 78.1 2009 78.5 2011 78.7 2013 78.8 a. Find the equation of the regression line, and explain the meaning of its slope. b. Plot the data points and the regression line. c. Explain in practical terms the meaning of the slope of the regression line. d. Based on the trend of the regression line, what do you predict as the life expectancy of a child born in 2019? e. Based on the trend of the regression line, what do you predict as the life expectancy of a child born in 1580?2300arrow_forwardSuppose that a kitchen cabinet warehouse company would like to be able to predict the area of a customer’s kitchen using the number of cabinets and the kitchen ceiling height. To do so data is collected on the following variables from a random sample of customers: Area – area of the kitchen in square feet Height – ceiling height in the kitchen (from floor to ceiling) in inches Cabinets – number of cabinets in the kitchen Suppose that a multiple linear regression model was fit to the data and that the following output resulted: Coefficients: (Intercept)HeightCabinets Estimate-57.98771.2760.3393 Std. Error8.63820.26430.1302 t value -6.7134.8282.607 Pr(>|t|)2.75e-074.44e-050.0145 Why is the interpretation of the constant term (i.e. "intercept") not meaningful for this example? The predicted area will be negative when the number of cabinets is zero and the height of the kitchen is also zero. But we cannot have a negative area, nor a kitchen ceiling height of 0 inches.…arrow_forwardSuppose a commercial developer in Vereeniging consider to purchase a group of small office buildings in an established business district. He uses multiple linear regression analysis, which was based on a sample of 35 office buildings, to estimate the value of an office building in a given area based on the following variables. Y = Assessed value of the office building (in Rand) X1= Floor space in square meters X2= Number of offices X3= Age of the office building in years Answer the questions that follow by typing only the letter of the correct option (A, B, C, D or E) in the answer spaces provided. Variablesy: Valuex1: Floor Spacex2: Officesx3: Age Model Fitting StatisticsR^2 = 0.9752Adj R^2: ? Regression Coefficients Beta Parameter Standard b Parameter Standard Estimates Error of Beta Estimates Error of b t Statistic Prob > |t|Intcpt…arrow_forward
- Why the regression line is a straight line rather than a curved line?arrow_forwardConsider the following sales data set and build a linear regression model. The number of weeks (X variable) is used to predict the number of vehicles sold (Y) variable. Number of Weeks Number of products sold 121 1371 121 1381 140 1088 118 1245 107 1118 190 1208 137 1382 128 1452 What is the sold cars value for the number of weeks is equal to 342 243 134 456 235arrow_forwardWhich of the following circumstances would likely produce a regression model with very “good fit”. Group of answer choices Using consumption expenditures as a LHS variable and disposable income as a RHS variable Using obesity rates in an area as a LHS variable and number of ice cream shops in the area as a RHS variable Using family size as a LHS variable and college tuition costs as a RHS variable Using number of cops in an area as a LHS variable and number of donut shops in an area as a RHS variable Using height as a LHS variable and income as a RHS variablearrow_forward
- Consider the following data on x= height of a building and y = number of stories for nine notable buildings in Atlanta, GA. Height,x 869 820 771 696 692 676 656 492 486 Stories,y 60 50 50 52 40 47 41 39 26 a. Find a linear regression model for this data. b. Write a sentence to interpret the meaning of the slope ℬ1 hate from your model. c. Does the population have a significant slope? Test at the 5% significane level. You may assume the assumptions of linear regression are satisfied.arrow_forwardTo determine if the listing price of a house influences the selling price; a financial analyst sampled fifty houses and collected data on sale price,Y,(in $’000) and listed price,X,(in$’000) and fitted a regression model to the dataarrow_forwardA sales manager collected the following data on annual sales for new customer accounts and the number of years of experience for a sample of 10 salespersons. Salesperson Years ofExperience Annual Sales($1,000s) 1 1 80 2 3 97 3 4 92 4 4 102 5 6 103 6 8 111 7 10 119 8 10 123 9 11 117 10 13 136 (a) Develop a scatter diagram for these data with years of experience as the independent variable. (b) Develop an estimated regression equation that can be used to predict annual sales (in $1,000s) given the years of experience. ŷ = (c) Use the estimated regression equation to predict annual sales (in $1,000s) for a salesperson with 9 years of experience. $ thousandarrow_forward
- The regional transit authority for a major metropolitan area wants to determine whetherthere is a relationship between the age of a bus and the annual maintenance cost. A sampleof ten buses resulted in the following data: a. Develop a scatter chart for these data. What does the scatter chart indicate about therelationship between age of a bus and the annual maintenance cost?b. Use the data to develop an estimated regression equation that could be used to predictthe annual maintenance cost given the age of the bus. What is the estimated regressionmodel?c. Test whether each of the regression parameters b0 and b1 is equal to zero at a 0.05level of significance. What are the correct interpretations of the estimated regressionparameters? Are these interpretations reasonable?d. How much of the variation in the sample values of annual maintenance cost does themodel you estimated in part b explain?e. What do you predict the annual maintenance cost to be for a 3.5-year-old bus?arrow_forwardFind the slope of the equation of the regression line for the following data: Consumer Price Index 30.2 48.3 112.3 162.2 191.9 197.8 Cost of Pizza 0.15 0.35 1.00 1.25 1.75 2.00arrow_forward
arrow_back_ios
arrow_forward_ios
Recommended textbooks for you
 Functions and Change: A Modeling Approach to Coll...AlgebraISBN:9781337111348Author:Bruce Crauder, Benny Evans, Alan NoellPublisher:Cengage Learning
 Glencoe Algebra 1, Student Edition, 9780079039897...AlgebraISBN:9780079039897Author:CarterPublisher:McGraw Hill
 Holt Mcdougal Larson Pre-algebra: Student Edition...AlgebraISBN:9780547587776Author:HOLT MCDOUGALPublisher:HOLT MCDOUGAL
 Big Ideas Math A Bridge To Success Algebra 1: Stu...AlgebraISBN:9781680331141Author:HOUGHTON MIFFLIN HARCOURTPublisher:Houghton Mifflin Harcourt
Functions and Change: A Modeling Approach to Coll...
Algebra
ISBN:9781337111348
Author:Bruce Crauder, Benny Evans, Alan Noell
Publisher:Cengage Learning
Glencoe Algebra 1, Student Edition, 9780079039897...
Algebra
ISBN:9780079039897
Author:Carter
Publisher:McGraw Hill
Holt Mcdougal Larson Pre-algebra: Student Edition...
Algebra
ISBN:9780547587776
Author:HOLT MCDOUGAL
Publisher:HOLT MCDOUGAL
Big Ideas Math A Bridge To Success Algebra 1: Stu...
Algebra
ISBN:9781680331141
Author:HOUGHTON MIFFLIN HARCOURT
Publisher:Houghton Mifflin Harcourt
Correlation Vs Regression: Difference Between them with definition & Comparison Chart; Author: Key Differences;https://www.youtube.com/watch?v=Ou2QGSJVd0U;License: Standard YouTube License, CC-BY
Correlation and Regression: Concepts with Illustrative examples; Author: LEARN & APPLY : Lean and Six Sigma;https://www.youtube.com/watch?v=xTpHD5WLuoA;License: Standard YouTube License, CC-BY