
EBK STATISTICAL TECHNIQUES IN BUSINESS
17th Edition
ISBN: 9781259924163
Author: Lind
Publisher: MCGRAW HILL BOOK COMPANY
expand_more
expand_more
format_list_bulleted
Concept explainers
Videos
Textbook Question
Chapter 14, Problem 4E
Cellulon, a manufacturer of home insulation, wants to develop guidelines for builders and consumers on how the thickness of the insulation in the attic of a home and the outdoor temperature affect natural gas consumption. In the laboratory, it varied the insulation thickness and temperature. A few of the findings are:
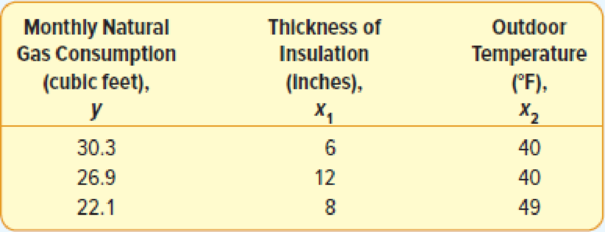
On the basis of the sample results, the regression equation is:
- a. How much natural gas can homeowners expect to use per month if they install 6 inches of insulation and the outdoor temperature is 40 degrees F?
- b. What effect would installing 7 inches of insulation instead of 6 have on the monthly natural gas consumption (assuming the outdoor temperature remains at 40 degrees F)?
- c. Why are the regression coefficients b1 and b2 negative? Is this logical?
Expert Solution & Answer
Want to see the full answer?
Check out a sample textbook solution
Students have asked these similar questions
A researcher investigated the relationship between family income and savings. Using data from 15 families, the computed r between income and savings was found to be 0.76. The researcher wants to test if there is a significant relationship between the two variables at 5% level of significance and create a regression equation to predict the possible savings given the income of the family.
Interpret the computed r value.
Test if there is a significant relationship between the two variables at 5% level of significance
What is measured by the standard error of estimaate for a regression equation?
A researcher examined the relationship between the annual tax amount paid by the construction company owners and the total expense items spent for the construction with regression analysis and calculated the regression line estimation as Y=6+2X. According to this; Write the interpretations of the cutoff and regression parameters, respectively, in your OWN SENTENCES in a statistically appropriate way over the tax amount and expenses.
Chapter 14 Solutions
EBK STATISTICAL TECHNIQUES IN BUSINESS
Ch. 14 - There are many restaurants in northeastern South...Ch. 14 - The director of marketing at Reeves Wholesale...Ch. 14 - Thompson Photo Works purchased several new, highly...Ch. 14 - A consulting group was hired by the Human...Ch. 14 - Cellulon, a manufacturer of home insulation, wants...Ch. 14 - Refer to Self-Review 141 on the subject of...Ch. 14 - Prob. 5ECh. 14 - Prob. 6ECh. 14 - Prob. 3SRCh. 14 - Given the following regression output, answer the...
Ch. 14 - The following regression output was obtained from...Ch. 14 - A study by the American Realtors Association...Ch. 14 - The manager of High Point Sofa and Chair, a large...Ch. 14 - Prob. 10ECh. 14 - Prob. 11ECh. 14 - A real estate developer wishes to study the...Ch. 14 - Prob. 13CECh. 14 - Prob. 14CECh. 14 - Prob. 15CECh. 14 - Prob. 16CECh. 14 - The district manager of Jasons, a large discount...Ch. 14 - Suppose that the sales manager of a large...Ch. 14 - The administrator of a new paralegal program at...Ch. 14 - Prob. 20CECh. 14 - Prob. 21CECh. 14 - A regional planner is studying the demographics of...Ch. 14 - Great Plains Distributors, Inc. sells roofing and...Ch. 14 - Prob. 24CECh. 14 - Prob. 25CECh. 14 - Prob. 26CECh. 14 - An investment advisor is studying the relationship...Ch. 14 - Prob. 28CECh. 14 - Prob. 29CECh. 14 - The director of special events for Sun City...Ch. 14 - Prob. 31CECh. 14 - Prob. 32CECh. 14 - Prob. 33DACh. 14 - Prob. 34DACh. 14 - Prob. 35DACh. 14 - Prob. 1PCh. 14 - Quick-print firms in a large downtown business...Ch. 14 - The following ANOVA output is given. a. Compute...Ch. 14 - Prob. 1CCh. 14 - Prob. 2CCh. 14 - Prob. 3CCh. 14 - In a scatter diagram, the dependent variable is...Ch. 14 - What level of measurement is required to compute...Ch. 14 - If there is no correlation between two variables,...Ch. 14 - Which of the following values indicates the...Ch. 14 - Under what conditions will the coefficient of...Ch. 14 - Given the following regression equation, = 7 ...Ch. 14 - Given the following regression equation, = 7 ...Ch. 14 - Given the following regression equation, = 7 ...Ch. 14 - Prob. 1.9PTCh. 14 - In a multiple regression equation, what is the...Ch. 14 - Prob. 1.11PTCh. 14 - Prob. 1.12PTCh. 14 - For a dummy variable, such as gender, how many...Ch. 14 - What is the term given to a table that shows all...Ch. 14 - If there is a linear relationship between the...Ch. 14 - Given the following regression analysis output: a....Ch. 14 - Given the following regression analysis output. a....
Knowledge Booster


Learn more about
Need a deep-dive on the concept behind this application? Look no further. Learn more about this topic, statistics and related others by exploring similar questions and additional content below.Similar questions
- If your graphing calculator is capable of computing a least-squares sinusoidal regression model, use it to find a second model for the data. Graph this new equation along with your first model. How do they compare?arrow_forwardAt a .01 level of significance is there sufficient evidence to conclude that the number of books sold is related to the number of registered students in a straight-line manner, and give the regression equation.arrow_forwardAccording to World Health Organization (WHO), the recommended limit for a noise level inside a classroom is 35 dBA. However, nine out of ten schools fail to meet this recommendation. A researcher wishes to conduct a study relevant to the prior information, but as a gap, he decides to include the area (in square meters) of every classroom and how it could possibly affect the resulting noise level. He selects 17 classrooms at random, and the noise levels are recorded in the next slide. a. Find the regression equation and construct the scatter plot diagram. b. Predict the noise level if a classroom has an area of 85.97 m2 . c. Calculate the coefficient of determination and interpret the findings. d. Calculate the coefficient of alienation and interpret the findings. Use Excelarrow_forward
- Why do we have in general, two lines of regression? Obtain the regression of Y on X and X on Y from the following table and estimate the blood pressure when the age is 45. Also give the interpretation.arrow_forwardA study in the univeristy of massachusetts amherst published in the may 2007 journal of marriage and family found that married women do about one fewer hour of housework a week for every $7500 they earn as a full time workers outside of the home, regardless of their husband's income A) what would be the numerical value of the slope coefficient in the regression model that predicts womens housework hours from their income? what does the sign of the slope (positive or negative) tell us about the relationship between these variables B) Suppose Lynette's salary is $30,000 greater than Gabriells. what would you predict the difference in hours of housework they each do.arrow_forwardDevelop an estimated multiple regression equation that relates risk of a stroke to a person's age, systolic blood pressure and whether the person is a smoker. x1=persons age x2systrolic blood pressure x3=whether person is a smoker or non smokerarrow_forward
- The correlation between first year college GPA and high school GPA is 0.683. If a simple linear regression was conducted to predict first year college GPA from high school GPA what does the correlation tell us about the fit of the model?arrow_forwardA car dealer wants to estimate the price of a used car based on the age of the car and the mileage. Based on a sample of 20 cars, she determines the sample regression equation that predicts price taxes on the basis of the age (in years) of the number of miles is Price=21,510-1230Age-0.035 Miles (a) If the age of the car was fixed and the mileage was increased by 10,000, would the price increase or decrease and by how much? (b) Predict the selling price of a five-year-old car with 65,000 miles. (Round your answers to the nearest whole number.)arrow_forwardListed below are systolic blood pressure measurements (in mm Hg) obtained from the same woman. Find the regression equation, letting the right arm blood pressure be the predictor (x) variable. Find the best predicted systolic blood pressure in the left arm given that the systolic blood pressure in the right arm is 95 mm Hg. Use a significance level of 0.05. Given that the systolic blood pressure in the right arm is 95 mm Hg, the best predicted systolic blood pressure in the left arm is ____ mm Hg. Right Arm Left Arm103 177102 17196 15076 14677 146arrow_forward
- The following data table shows the historical data for the first semester 2020, of the amount of sales of the company "IRC", which sells sneakers. Utilizing multiple lineal regression (as shown on the image), find an equation that estimates the number of sneakers sold by the company, based on advertising and revenue. Also, determine the standard error of estimation, the coefficient of determination, and the correlation coefficient. Write down what was the quantity in thousands sold in July if the amount of ads was 8 and the income for each unit was $135arrow_forwardA regression analysis was applied between the sales data (in $1000s) and advertising data (in $100s) and the fitted regression line obtained is Y=1.2x+18. If advertising is $2000, what is the point estimate for the sales?arrow_forwardWrite out the regression equation based on the output. What happens to exam performance with every increase in exam anxiety and what do you notice about the standardized regression coefficient (Beta) and the correlation?arrow_forward
arrow_back_ios
SEE MORE QUESTIONS
arrow_forward_ios
Recommended textbooks for you
 Trigonometry (MindTap Course List)TrigonometryISBN:9781305652224Author:Charles P. McKeague, Mark D. TurnerPublisher:Cengage Learning
Trigonometry (MindTap Course List)
Trigonometry
ISBN:9781305652224
Author:Charles P. McKeague, Mark D. Turner
Publisher:Cengage Learning
Correlation Vs Regression: Difference Between them with definition & Comparison Chart; Author: Key Differences;https://www.youtube.com/watch?v=Ou2QGSJVd0U;License: Standard YouTube License, CC-BY
Correlation and Regression: Concepts with Illustrative examples; Author: LEARN & APPLY : Lean and Six Sigma;https://www.youtube.com/watch?v=xTpHD5WLuoA;License: Standard YouTube License, CC-BY