
EBK STATISTICAL TECHNIQUES IN BUSINESS
17th Edition
ISBN: 9781259924163
Author: Lind
Publisher: MCGRAW HILL BOOK COMPANY
expand_more
expand_more
format_list_bulleted
Concept explainers
Videos
Textbook Question
Chapter 14, Problem 2SR
Refer to Self-Review 14–1 on the subject of restaurants in Myrtle Beach. The ANOVA portion of the regression output is presented below.
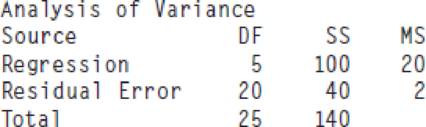
- (a) How large was the sample?
- (b) How many independent variables are there?
- (c) How many dependent variables are there?
- (d) Compute the standard error of estimate. About 95% of the residuals will be between what two values?
- (e) Determine the coefficient of multiple determination. Interpret this value.
- (f) Find the coefficient of multiple determination, adjusted for the degrees of freedom.
Expert Solution & Answer
Want to see the full answer?
Check out a sample textbook solution
Students have asked these similar questions
In a simple bivariate regression with 25 observations, is a non standardized residual of e1 =4.22 considered an outlier?
Suppose that a sample of n = 12 pairs of X and Y scores has SSY = 90 and a Pearson correlation of r = +0.40. Does the regression equation predict a significant portion of the variance? Test with α = .05.(hint: SStotal = SSY; r2 = SSregression/SSTotal)
The attached results are for a multiple regression study of smartphone addiction (SSA-SV) proneness in relation to 1) Gender 2)Age 3) Anxiety (GAD-7). I just want to clarify what the F-statistic means and the effects of AGE on the F-statistic; given that AGE is statistically significant compared to the other predictor variables.
Chapter 14 Solutions
EBK STATISTICAL TECHNIQUES IN BUSINESS
Ch. 14 - There are many restaurants in northeastern South...Ch. 14 - The director of marketing at Reeves Wholesale...Ch. 14 - Thompson Photo Works purchased several new, highly...Ch. 14 - A consulting group was hired by the Human...Ch. 14 - Cellulon, a manufacturer of home insulation, wants...Ch. 14 - Refer to Self-Review 141 on the subject of...Ch. 14 - Prob. 5ECh. 14 - Prob. 6ECh. 14 - Prob. 3SRCh. 14 - Given the following regression output, answer the...
Ch. 14 - The following regression output was obtained from...Ch. 14 - A study by the American Realtors Association...Ch. 14 - The manager of High Point Sofa and Chair, a large...Ch. 14 - Prob. 10ECh. 14 - Prob. 11ECh. 14 - A real estate developer wishes to study the...Ch. 14 - Prob. 13CECh. 14 - Prob. 14CECh. 14 - Prob. 15CECh. 14 - Prob. 16CECh. 14 - The district manager of Jasons, a large discount...Ch. 14 - Suppose that the sales manager of a large...Ch. 14 - The administrator of a new paralegal program at...Ch. 14 - Prob. 20CECh. 14 - Prob. 21CECh. 14 - A regional planner is studying the demographics of...Ch. 14 - Great Plains Distributors, Inc. sells roofing and...Ch. 14 - Prob. 24CECh. 14 - Prob. 25CECh. 14 - Prob. 26CECh. 14 - An investment advisor is studying the relationship...Ch. 14 - Prob. 28CECh. 14 - Prob. 29CECh. 14 - The director of special events for Sun City...Ch. 14 - Prob. 31CECh. 14 - Prob. 32CECh. 14 - Prob. 33DACh. 14 - Prob. 34DACh. 14 - Prob. 35DACh. 14 - Prob. 1PCh. 14 - Quick-print firms in a large downtown business...Ch. 14 - The following ANOVA output is given. a. Compute...Ch. 14 - Prob. 1CCh. 14 - Prob. 2CCh. 14 - Prob. 3CCh. 14 - In a scatter diagram, the dependent variable is...Ch. 14 - What level of measurement is required to compute...Ch. 14 - If there is no correlation between two variables,...Ch. 14 - Which of the following values indicates the...Ch. 14 - Under what conditions will the coefficient of...Ch. 14 - Given the following regression equation, = 7 ...Ch. 14 - Given the following regression equation, = 7 ...Ch. 14 - Given the following regression equation, = 7 ...Ch. 14 - Prob. 1.9PTCh. 14 - In a multiple regression equation, what is the...Ch. 14 - Prob. 1.11PTCh. 14 - Prob. 1.12PTCh. 14 - For a dummy variable, such as gender, how many...Ch. 14 - What is the term given to a table that shows all...Ch. 14 - If there is a linear relationship between the...Ch. 14 - Given the following regression analysis output: a....Ch. 14 - Given the following regression analysis output. a....
Knowledge Booster


Learn more about
Need a deep-dive on the concept behind this application? Look no further. Learn more about this topic, statistics and related others by exploring similar questions and additional content below.Similar questions
- A multiple regression analysis between yearly income(y in $1,000s), college grade point average(X1) , age of the individuals (X2), and the gender of the individual (X3); zero representing female and one representing male) was performed on a sample of 10 people, and the following results were obtained. Coefficient Standard Error Constant 4.0928 1.4400 X1 10.0230 1.6512 X2 0.1020 0.1225 X3 -4.4811 1.4400 Analysis of Variance Source of Degrees of Sum of Mean Variance Freedom Squares Square F Regression 360.59 Error 23.91 Write the regression equation for the above. Interpret the meaning of the coefficient of X3. Compute the coefficient…arrow_forwardFor a linear regression for a sample of n=20 pairs of X and Y values. What is the value of the degrees of freedom for the predicted portion of the Y-score variance, MSregression?arrow_forwardGive an example of a research question that would be suitable for computing a: a) Correlation coefficient b) Regression linearrow_forward
- Consider the multiple regression model shown next between the dependent variable Y and four independent variables X1, X2, X3, and X4, which results in the following function:Ŷ = 33 + 8X1 − 6X2 + 16X3 + 18X4For this model, there were 35 observations; SSR = 1,544 and SSE = 600. Assume a 0.01 significance level.Based on the given information, which of the following conclusions is correct about the statistical significance of the overall model? Multiple Choice Reject the null hypothesis that β3 = 0. Do not reject the null hypothesis that β1 = β2 = β3 = β4 = 0. Reject the null hypothesis that β1 = 0. Reject the null hypothesis that β1 = β2 = β3 = β4 = 0.arrow_forwardA newspaper used an estimated regression equation to describe the relationship between y = error percentage for subjects reading a four-digit liquid crystal display and the independent variables x1 = level of backlight, x2 = character subtense, x3 = viewing angle, and x4 = level of ambient light. From a table given in the article, SSRegr = 21.6, SSResid = 22, and n = 30. What is the value of the test statistic F What is the P-value What is r2 What is Searrow_forwardWhich of the following assumptions is not necessary for unbiasedness of a slope coefficient in a multiple regression model? MLR1 MLR 4 Homoskedasticity Random samplingarrow_forward
- Which of the following scatterplots provides evidence that the condition of equal variance for inference for the slope of a regression line has not been met?arrow_forwardIf there is no significant correlation between the response and explanatory variables, would the slope of the regression line be (a) positive (b) negative (c) zero?arrow_forwardIn the ANOVA table for a multiple regression, which of the following is not true? a. The mean square due to the regression, MSR, divided by the mean square error, MSE, equals the F ratio used for testing the significance of the regression as a whole. b. A small F ratio leads to a small p-value, indicating that the regression has at least some explanatory power. c. The sum of squares due to the regression, SSR, and the sum of squares due to errors, SSE, sum to SST, which equals the sum of squared deviations of Y values from the mean of Y. d. The degrees of freedom for the explained variation and the degrees of freedom for the unexplained variation sum to n-1, where n is the sample size.arrow_forward
- What are the assumptions of simple linear regression (and as a consequence the pearson’s r correlation)?arrow_forwardA researcher wants to forecast the annual sales of Walmart, based on store size. To examine the relationship between the store size in square feet and its annual sales in million dollars, a sample of 14 stores was selected shown below in the image: Answer the following: i) Null hypothesis of correlation ii) Coefficient of Correlation and its interpretation iii) Interpret the sig value of ANOVA. iv) Coefficient of Determination and its interpretation v) Write down the Regression Model. vi) Interpret the value of ‘a’ vii) Interpret the value of ‘slope’arrow_forwardIn a multiple regression analysis involving 10 independent variables and 81 observations, SST = 120 and SSE = 42. The coefficient of determination is ______.arrow_forward
arrow_back_ios
SEE MORE QUESTIONS
arrow_forward_ios
Recommended textbooks for you
 Glencoe Algebra 1, Student Edition, 9780079039897...AlgebraISBN:9780079039897Author:CarterPublisher:McGraw Hill
Glencoe Algebra 1, Student Edition, 9780079039897...
Algebra
ISBN:9780079039897
Author:Carter
Publisher:McGraw Hill
Correlation Vs Regression: Difference Between them with definition & Comparison Chart; Author: Key Differences;https://www.youtube.com/watch?v=Ou2QGSJVd0U;License: Standard YouTube License, CC-BY
Correlation and Regression: Concepts with Illustrative examples; Author: LEARN & APPLY : Lean and Six Sigma;https://www.youtube.com/watch?v=xTpHD5WLuoA;License: Standard YouTube License, CC-BY