
Videos
1.
Compute the new cost per pound for each product.
1.
Explanation of Solution
Environmental costs: Environmental costs are incurred due to poor environmental quality that may or may not exist.
Compute the new cost per pound for each product:
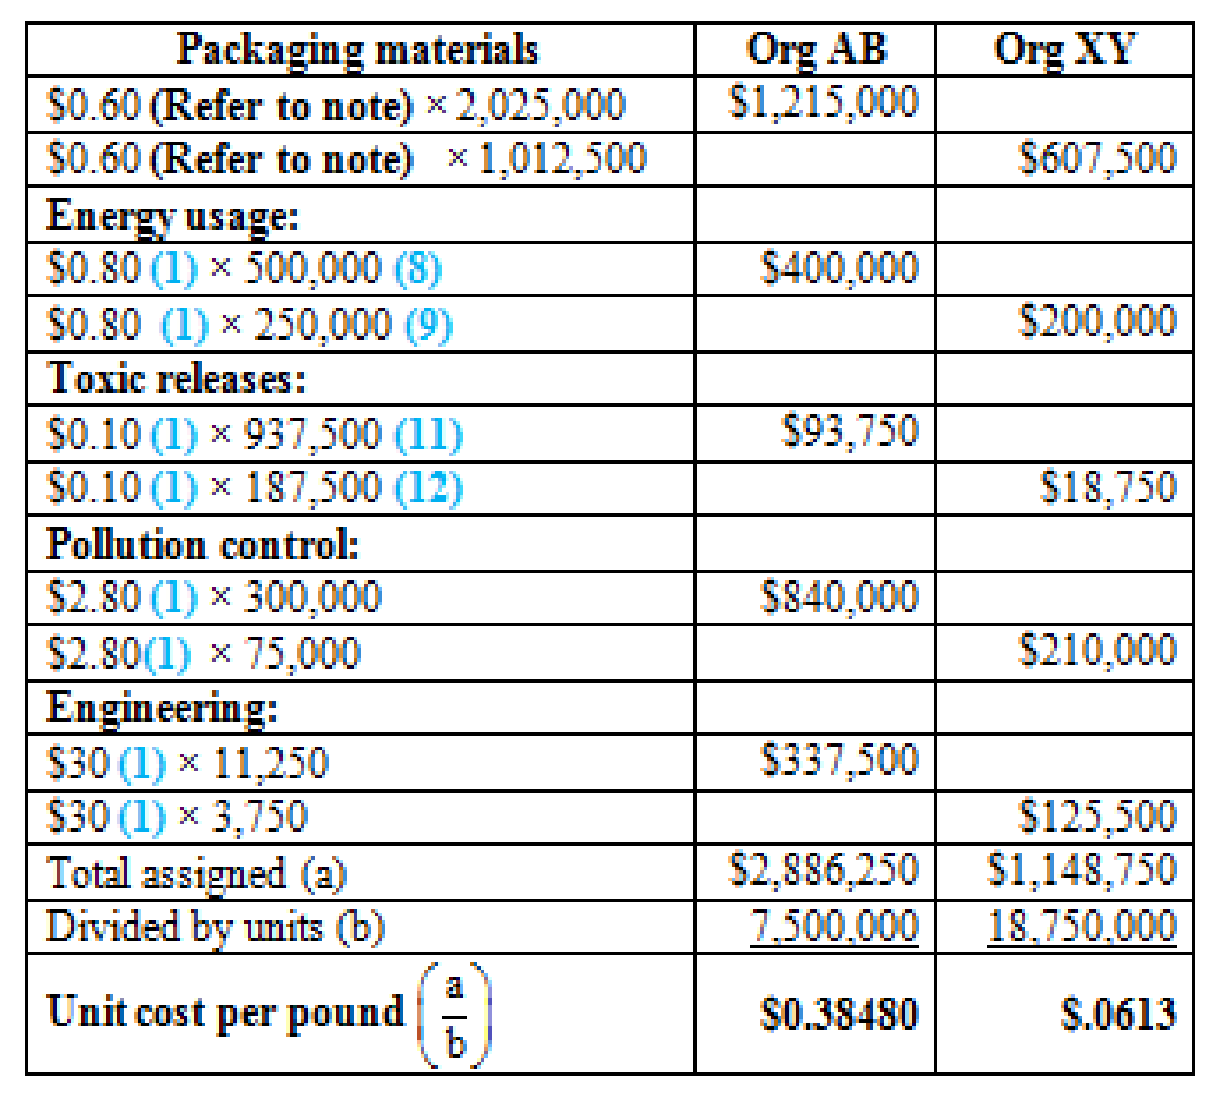
Figure (1)
Note: Pounds of packaging is the driver for both packaging and packaging treatment, therefore the rates can be combined
Working notes:
Calculate the activity rates:
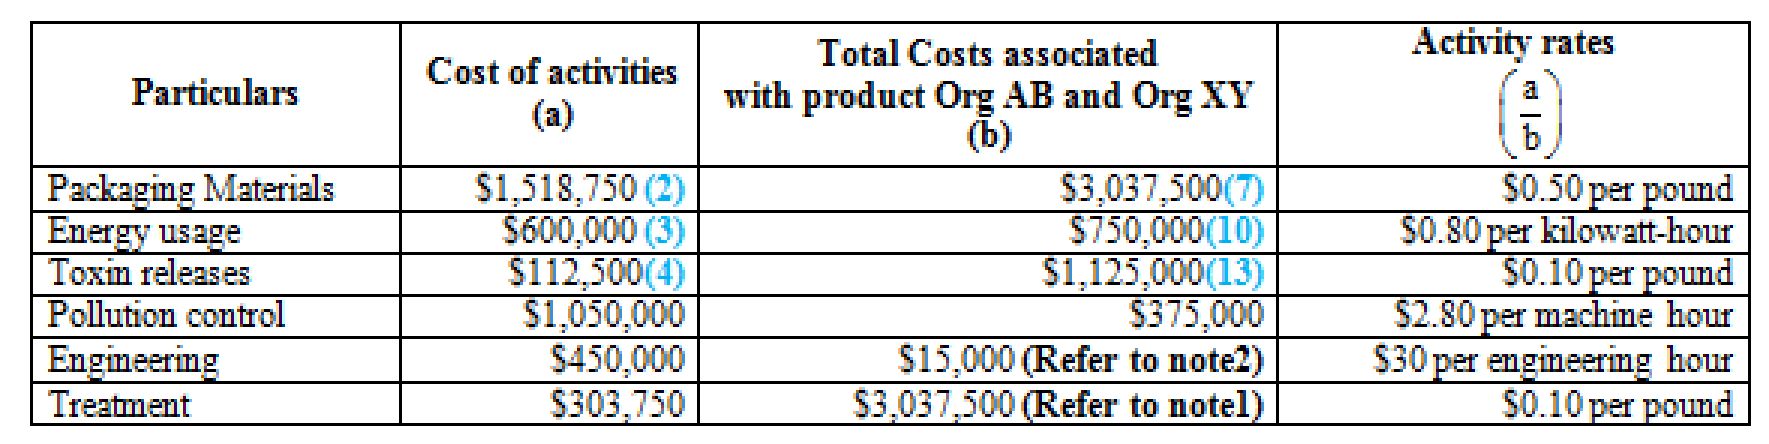
Figure (2)
Note 1: Since pounds of packaging are the driver for both packaging and packaging treatment, $3,037,500 is the total costs associated with product Org AB and Org XY.
Note 2: Total engineering hours are 15,000 (11,250 for Org AB and 3,750 for Org XY).
(2)Calculate the new cost of activity-packaging materials:
(3)Calculate the new cost of activity-Energy usage:
Note:
(4)Calculate the new cost of activity-Toxin releases:
Note:
(5)Calculate the cost of packaging materials for Org AB:
Note:
(6)Calculate the cost of packaging materials for Org XY:
Note:
(7)Calculate the total costs associated with packaging materials for both products Org AB and Org XY:
(8)Calculate the cost of energy usage for Org AB:
Note:
(9)Calculate the cost of energy usage for Org XY:
Note:
(10)Calculate the total costs associated with energy usage for both products Org AB and Org XY:
(11)Calculate the cost of toxin releases for Org AB:
Note:
(12)Calculate the cost of toxin releases for Org XY:
Note:
(13)Calculate the total costs associated with toxin releases for both products Org AB and Org XY:
2.
Compute the net savings produced by the environmental changes for each product in total and on a per-unit basis and explain whether this supports the concept of eco-efficiency.
2.
Explanation of Solution
Eco-efficiency: Eco-efficiency is referred as the capability to produce competitively priced goods and services that satisfies the needs and wants of the customer while simultaneously decreasing undesirable environmental impacts.
Compute the net savings produced by the environmental changes for each product in total and on a per-unit basis:
| Particulars | Org AB | Org XY | Total |
| Before |
$4,065,000 (Refer to note) |
$1,710,000 (Refer to note) | $5,775,000 |
| After | 2,886,250 | $1,148,750 | $4,035,000 |
| Total savings (a) | $1,178,750 | $561,250 | $1,740,000 |
| Pounds (b) | 7,500,000 | 18,750,000 | |
| Unit savings | $0.1572 | 0.0299 |
Table (1)
Note: Refer to 23E for the value of amounts.
According to the above calculation, it is noted that eco-efficiency can be improved by improving environmental performance.
3.
Categorize the activities as prevention, detection, internal failure or external failure.
3.
Explanation of Solution
Classify the activities:
| Particulars | Classification |
| Excessive energy and materials | External failure |
| Releasing toxins | External failure |
| Operating pollution control equipment | Internal failure |
| Engineering | Prevention |
Table (2)
4.
Explain the manner n which the environmental improvements can contribute for improving the competitive position of the company.
4.
Explanation of Solution
- The reduced environmental damage may also enhance product and company images, with the potential of attracting more customers. Other possible benefits that may contribute to a competitive advantage include a lower cost of capital and lower insurance costs.
- Product and company reputation can be enhanced by reducing environmental damage, with the idea of attracting more number of customers. Other probable advantage that might contribute to a competitive advantage is by including a lower cost of insurance and lower cost of capital.
Want to see more full solutions like this?
Chapter 14 Solutions
Cornerstones of Cost Management (Cornerstones Series)


- Recently, Ulrich Company received a report from an external consulting group on its quality costs. The consultants reported that the companys quality costs total about 21 percent of its sales revenues. Somewhat shocked by the magnitude of the costs, Rob Rustin, president of Ulrich Company, decided to launch a major quality improvement program. For the coming year, management decided to reduce quality costs to 17 percent of sales revenues. Although the amount of reduction was ambitious, most company officials believed that the goal could be realized. To improve the monitoring of the quality improvement program, Rob directed Pamela Golding, the controller, to prepare monthly performance reports comparing budgeted and actual quality costs. Budgeted costs and sales for the first two months of the year are as follows: The following actual sales and actual quality costs were reported for January: Required: 1. Reorganize the monthly budgets so that quality costs are grouped in one of four categories: appraisal, prevention, internal failure, or external failure. (Essentially, prepare a budgeted cost of quality report.) Also, identify each cost as variable (V) or fixed (F). (Assume that no costs are mixed.) 2. Prepare a performance report for January that compares actual costs with budgeted costs. Comment on the companys progress in improving quality and reducing its quality costs.arrow_forwardIn 20x5, Major Company initiated a full-scale, quality improvement program. At the end of the year, Jack Aldredge, the president, noted with some satisfaction that the defects per unit of product had dropped significantly compared to the prior year. He was also pleased that relationships with suppliers had improved and defective materials had declined. The new quality training program was also well accepted by employees. Of most interest to the president, however, was the impact of the quality improvements on profitability. To help assess the dollar impact of the quality improvements, the actual sales and the actual quality costs for 20x4 and 20x5 are as follows by quality category: All prevention costs are fixed (by discretion). Assume all other quality costs are unit-level variable. Required: 1. Compute the relative distribution of quality costs for each year and prepare a pie chart. Do you believe that the company is moving in the right direction in terms of the balance among the quality cost categories? Explain. 2. Prepare a one-year trend performance report for 20x5 (compare the actual costs of 20x5 with those of 20x4, adjusted for differences in sales volume). How much have profits increased because of the quality improvements made by Major Company? 3. Estimate the additional improvement in profits if Major Company ultimately reduces its quality costs to 2.5 percent of sales revenues (assume sales of 10 million).arrow_forwardGagnon Company reported the following sales and quality costs for the past four years. Assume that all quality costs are variable and that all changes in the quality cost ratios are due to a quality improvement program. Required: 1. Compute the quality costs for all four years. By how much did net income increase from Year 1 to Year 2 because of quality improvements? From Year 2 to Year 3? From Year 3 to Year 4? 2. The management of Gagnon Company believes it is possible to reduce quality costs to 2.5 percent of sales. Assuming sales will continue at the Year 4 level, calculate the additional profit potential facing Gagnon. Is the expectation of improving quality and reducing costs to 2.5 percent of sales realistic? Explain. 3. Assume that Gagnon produces one type of product, which is sold on a bid basis. In Years 1 and 2, the average bid was 400. In Year 1, total variable costs were 250 per unit. In Year 3, competition forced the bid to drop to 380. Compute the total contribution margin in Year 3 assuming the same quality costs as in Year 1. Now, compute the total contribution margin in Year 3 using the actual quality costs for Year 3. What is the increase in profitability resulting from the quality improvements made from Year 1 to Year 3?arrow_forward
- In 20X1, Don Blackburn, president of Price Electronics, received a report indicating that quality costs were 31% of sales. Faced with increasing pressures from imported goods. Don resolved to take measures to improve the overall quality of the companys products. After hiring a consultant in 20X1, the company began an aggressive program of total quality control. At the end of 20X5, Don requested an analysis of the progress the company had made in reducing and controlling quality costs. The accounting department assembled the following data: Required: 1. Compute the quality costs as a percentage of sales by category and in total for each year. 2. Prepare a multiple-year trend graph for quality costs, both by total costs and by category. Using the graph, assess the progress made in reducing and controlling quality costs. Does the graph provide evidence that quality has improved? Explain. 3. Using the 20X1 quality cost relationships (assume all costs are variable), calculate the quality costs that would have prevailed in 20X4. By how much did profits increase in 20X4 because of the quality improvement program? Repeat for 20X5.arrow_forwardIn 2011, Milton Thayne, president of Carbondale Electronics, received a report indicating that quality costs were 31 percent of sales. Faced with increasing pressures from imported goods, Milton resolved to take measures to improve the overall quality of the companys products. After hiring a consultant in 20x0, the company began an aggressive program of total quality control. At the end of 20x5, Milton requested an analysis of the progress the company had made in reducing and controlling quality costs. The Accounting Department assembled the following data: Required: 1. Compute the quality costs as a percentage of sales by category and in total for each year. 2. Prepare a multiple-year trend graph for quality costs, both by total costs and by category. Using the graph, assess the progress made in reducing and controlling quality costs. Does the graph provide evidence that quality has improved? Explain. 3. Using the 20x1 quality cost relationships (assume all costs are variable), calculate the quality costs that would have prevailed in 20x4. By how much did profits increase in 20x4 because of the quality improvement program? Repeat for 20x5.arrow_forwardThe following environmental cost reports for 20x3, 20x4, and 20x5 (year end December 31) are for the Communications Products Division of Kartel, a telecommunications company. In 2011, Kartel committed itself to a continuous environmental improvement program, which was implemented throughout the company. At the beginning of 20x5, Kartel began a new program of recycling nonhazardous scrap. The effort produced recycling income totaling 25,000. The marketing vice president and the environmental manager estimated that sales revenue had increased by 200,000 per year since 20x3 because of an improved public image relative to environmental performance. The companys Finance Department also estimated that Kartel saved 80,000 in 20x5 because of reduced finance and insurance costs, all attributable to improved environmental performance. All reductions in environmental costs from 20x3 to 20x5 are attributable to improvement efforts. Furthermore, any reductions represent ongoing savings. Required: 1. Prepare an environmental financial statement for 20x5 (for the Products Division). In the cost section, classify environmental costs by category (prevention, detection, etc.). 2. Evaluate the changes in environmental performance.arrow_forward
- Lindell Manufacturing embarked on an ambitious quality program that is centered on continual improvement. This improvement is operationalized by declining quality costs from year to year. Lindell rewards plant managers, production supervisors, and workers with bonuses ranging from 1,000 to 10,000 if their factory meets its annual quality cost goals. Len Smith, manager of Lindells Boise plant, felt obligated to do everything he could to provide this increase to his employees. Accordingly, he has decided to take the following actions during the last quarter of the year to meet the plants budgeted quality cost targets: a. Decrease inspections of the process and final product by 50% and transfer inspectors temporarily to quality training programs. Len believes this move will increase the inspectors awareness of the importance of quality; also, decreasing inspection will produce significantly less downtime and less rework. By increasing the output and decreasing the costs of internal failure, the plant can meet the budgeted reductions for internal failure costs. Also, by showing an increase in the costs of quality training, the budgeted level for prevention costs can be met. b. Delay replacing and repairing defective products until the beginning of the following year. While this may increase customer dissatisfaction somewhat, Len believes that most customers expect some inconvenience. Besides, the policy of promptly dealing with customers who are dissatisfied could be reinstated in 3 months. In the meantime, the action would significantly reduce the costs of external failure, allowing the plant to meet its budgeted target. c. Cancel scheduled worker visits to customers plants. This program, which has been very well received by customers, enables Lindell workers to see just how the machinery they make is used by the customer and also gives them first-hand information on any remaining problems with the machinery. Workers who went on previous customer site visits came back enthusiastic and committed to Lindells quality program. Lindells quality program staff believes that these visits will reduce defects during the following year. Required: 1. Evaluate Lens ethical behavior. In this evaluation, consider his concern for his employees. Was he justified in taking the actions described? If not, what should he have done? 2. Assume that the company views Lens behavior as undesirable. What can the company do to discourage it? 3. Assume that Len is a CMA and a member of the IMA. Refer to the ethical code for management accountants in Chapter 1. Were any of these ethical standards violated?arrow_forwardAt the end of 20x1, Mejorar Company implemented a low-cost strategy to improve its competitive position. Its objective was to become the low-cost producer in its industry. A Balanced Scorecard was developed to guide the company toward this objective. To lower costs, Mejorar undertook a number of improvement activities such as JIT production, total quality management, and activity-based management. Now, after two years of operation, the president of Mejorar wants some assessment of the achievements. To help provide this assessment, the following information on one product has been gathered: Required: 1. Compute the following measures for 20x1 and 20x3: a. Actual velocity and cycle time b. Percentage of total revenue from new customers (assume one unit per customer) c. Percentage of very satisfied customers (assume each customer purchases one unit) d. Market share e. Percentage change in actual product cost (for 20x3 only) f. Percentage change in days of inventory (for 20x3 only) g. Defective units as a percentage of total units produced h. Total hours of training i. Suggestions per production worker j. Total revenue k. Number of new customers 2. For the measures listed in Requirement 1, list likely strategic objectives, classified according to the four Balance Scorecard perspectives. Assume there is one measure per objective.arrow_forwardJavier Company has sales of 8 million and quality costs of 1,600,000. The company is embarking on a major quality improvement program. During the next three years, Javier intends to attack failure costs by increasing its appraisal and prevention costs. The right prevention activities will be selected, and appraisal costs will be reduced according to the results achieved. For the coming year, management is considering six specific activities: quality training, process control, product inspection, supplier evaluation, prototype testing, and redesign of two major products. To encourage managers to focus on reducing non-value-added quality costs and select the right activities, a bonus pool is established relating to reduction of quality costs. The bonus pool is equal to 10 percent of the total reduction in quality costs. Current quality costs and the costs of these six activities are given in the following table. Each activity is added sequentially so that its effect on the cost categories can be assessed. For example, after quality training is added, the control costs increase to 320,000, and the failure costs drop to 1,040,000. Even though the activities are presented sequentially, they are totally independent of each other. Thus, only beneficial activities need be selected. Required: 1. Identify the control activities that should be implemented, and calculate the total quality costs associated with this selection. Assume that an activity is selected only if it increases the bonus pool. 2. Given the activities selected in Requirement 1, calculate the following: a. The reduction in total quality costs b. The percentage distribution for control and failure costs c. The amount for this years bonus pool 3. Suppose that a quality engineer complained about the gainsharing incentive system. Basically, he argued that the bonus should be based only on reductions of failure and appraisal costs. In this way, investment in prevention activities would be encouraged, and eventually, failure and appraisal costs would be eliminated. After eliminating the non-value-added costs, focus could then be placed on the level of prevention costs. If this approach were adopted, what activities would be selected? Do you agree or disagree with this approach? Explain.arrow_forward
- At the beginning of the last quarter of 20x1, Youngston, Inc., a consumer products firm, hired Maria Carrillo to take over one of its divisions. The division manufactured small home appliances and was struggling to survive in a very competitive market. Maria immediately requested a projected income statement for 20x1. In response, the controller provided the following statement: After some investigation, Maria soon realized that the products being produced had a serious problem with quality. She once again requested a special study by the controllers office to supply a report on the level of quality costs. By the middle of November, Maria received the following report from the controller: Maria was surprised at the level of quality costs. They represented 30 percent of sales, which was certainly excessive. She knew that the division had to produce high-quality products to survive. The number of defective units produced needed to be reduced dramatically. Thus, Maria decided to pursue a quality-driven turnaround strategy. Revenue growth and cost reduction could both be achieved if quality could be improved. By growing revenues and decreasing costs, profitability could be increased. After meeting with the managers of production, marketing, purchasing, and human resources, Maria made the following decisions, effective immediately (end of November 20x1): a. More will be invested in employee training. Workers will be trained to detect quality problems and empowered to make improvements. Workers will be allowed a bonus of 10 percent of any cost savings produced by their suggested improvements. b. Two design engineers will be hired immediately, with expectations of hiring one or two more within a year. These engineers will be in charge of redesigning processes and products with the objective of improving quality. They will also be given the responsibility of working with selected suppliers to help improve the quality of their products and processes. Design engineers were considered a strategic necessity. c. Implement a new process: evaluation and selection of suppliers. This new process has the objective of selecting a group of suppliers that are willing and capable of providing nondefective components. d. Effective immediately, the division will begin inspecting purchased components. According to production, many of the quality problems are caused by defective components purchased from outside suppliers. Incoming inspection is viewed as a transitional activity. Once the division has developed a group of suppliers capable of delivering nondefective components, this activity will be eliminated. e. Within three years, the goal is to produce products with a defect rate less than 0.10 percent. By reducing the defect rate to this level, marketing is confident that market share will increase by at least 50 percent (as a consequence of increased customer satisfaction). Products with better quality will help establish an improved product image and reputation, allowing the division to capture new customers and increase market share. f. Accounting will be given the charge to install a quality information reporting system. Daily reports on operational quality data (e.g., percentage of defective units), weekly updates of trend graphs (posted throughout the division), and quarterly cost reports are the types of information required. g. To help direct the improvements in quality activities, kaizen costing is to be implemented. For example, for the year 20x1, a kaizen standard of 6 percent of the selling price per unit was set for rework costs, a 25 percent reduction from the current actual cost. To ensure that the quality improvements were directed and translated into concrete financial outcomes, Maria also began to implement a Balanced Scorecard for the division. By the end of 20x2, progress was being made. Sales had increased to 26,000,000, and the kaizen improvements were meeting or beating expectations. For example, rework costs had dropped to 1,500,000. At the end of 20x3, two years after the turnaround quality strategy was implemented, Maria received the following quality cost report: Maria also received an income statement for 20x3: Maria was pleased with the outcomes. Revenues had grown, and costs had been reduced by at least as much as she had projected for the two-year period. Growth next year should be even greater as she was beginning to observe a favorable effect from the higher-quality products. Also, further quality cost reductions should materialize as incoming inspections were showing much higher-quality purchased components. Required: 1. Identify the strategic objectives, classified by the Balanced Scorecard perspective. Next, suggest measures for each objective. 2. Using the results from Requirement 1, describe Marias strategy using a series of if-then statements. Next, prepare a strategy map. 3. Explain how you would evaluate the success of the quality-driven turnaround strategy. What additional information would you like to have for this evaluation? 4. Explain why Maria felt that the Balanced Scorecard would increase the likelihood that the turnaround strategy would actually produce good financial outcomes. 5. Advise Maria on how to encourage her employees to align their actions and behavior with the turnaround strategy.arrow_forwardIn 20x4, Tru-Delite Frozen Desserts, Inc., instituted a quality improvement program. At the end of 20x5, the management of the corporation requested a report to show the amount saved by the measures taken during the year. The actual sales and quality costs for 20x4 and 20x5 are as follows: Tru-Delites management believes that quality costs can be reduced to 2.5 percent of sales within the next five years. At the end of 20x9, Tru-Delites sales are projected to grow to 750,000. The projected relative distribution of quality costs at the end of 20x9 is as follows: Required: 1. Profits increased by what amount due to quality improvements made in 20x5? 2. Prepare a long-range performance report that compares the quality costs incurred at the end of 20x5 with the quality cost structure expected at the end of 20x9. 3. Are the targeted costs in the year 20x9 all value-added costs? How would you interpret the variances if the targeted costs are value-added costs? 4. What would be the profit increase in 20x9 if the 2.5 percent performance standard is met in that year?arrow_forwardBradford Company, a manufacturer of small tools, implemented lean manufacturing at the end of 20x1. The companys goal for the year was to increase the ROS to 40 percent of sales. A value-stream team was established and began to work on lean improvements. During the year, the team was able to achieve significant results on several fronts. The Box Scorecard below reflects the performance measures at the beginning of the year, midyear, and end of year. Although the team members were pleased with their progress, they were disappointed in the financial results. They were still far from the targeted ROS of 40 percent. They were also puzzled as to why the improvements made did not translate into significantly improved financial performance. Required: 1. From the scorecard, what was the focus of the value-stream team for the first six months? The second six months? What are the implications of these changes? 2. Using information from the scorecard, offer an explanation for why the financial results were not as good as expected. 3. Suppose that on December 31, 20x2, a potential customer offered to purchase an order of goods that would increase weekly revenues in January by 100,000 and material cost by 30,000. Using the old standard cost system, the projected conversion cost of the order would be 60,000. Would you recommend that the order be accepted or rejected? Explain.arrow_forward
 Cornerstones of Cost Management (Cornerstones Ser...AccountingISBN:9781305970663Author:Don R. Hansen, Maryanne M. MowenPublisher:Cengage Learning
 Managerial Accounting: The Cornerstone of Busines...AccountingISBN:9781337115773Author:Maryanne M. Mowen, Don R. Hansen, Dan L. HeitgerPublisher:Cengage Learning