
MyLab Statistics for Business Stats with Pearson eText -- Standalone Access Card -- for Statistics for Business and Economics
13th Edition
ISBN: 9780134748610
Author: James T. McClave, P. George Benson, Terry Sincich
Publisher: PEARSON
expand_more
expand_more
format_list_bulleted
Videos
Textbook Question
Chapter 14.2, Problem 14.19ACI
Yearly price of gold. The price of gold is used by some financial analysts as a barometer of investors’ expectations of inflation, with the price of gold tending to increase as concerns about inflation increase. The table below shows the average annual price of gold (in dollars per ounce) from 1990 through 2015.
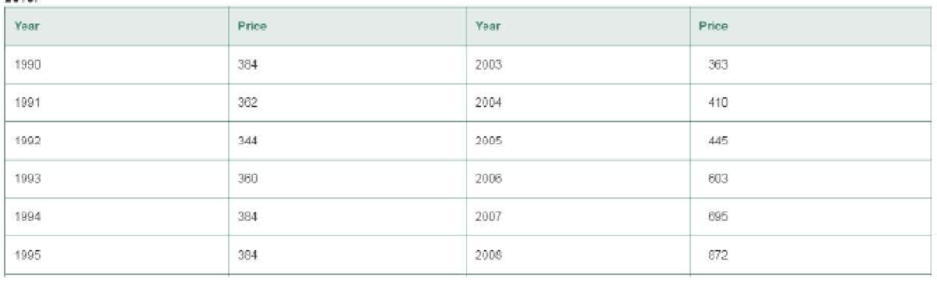
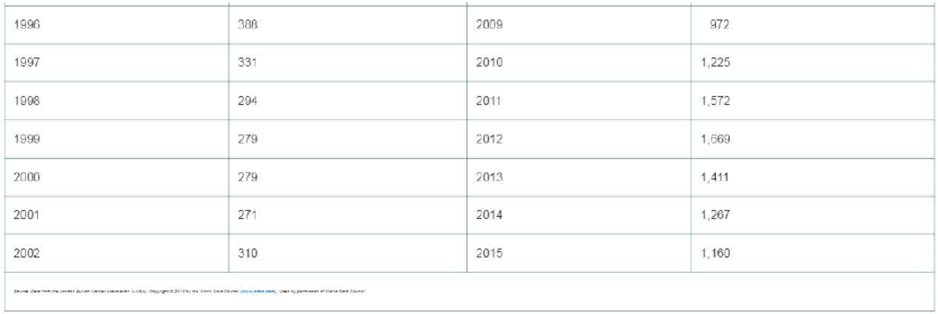
a. Compute an exponentially smoothed series for the gold price time series for the period from 1990 to 2015, using a smoothing coefficient of w = .8.
b. Plot the original series and the exponentially smoothed series on the same graph. Comment on the trend observed.
Expert Solution & Answer
Want to see the full answer?
Check out a sample textbook solution
Students have asked these similar questions
2//
Using simple exponential smoothing and the following time series data, respond to each of the items.
Period. Demand
1. 104
2. 132
3. 143
4. 137
5. 146
6. 150
7. 101
8. 126
9. 116
10. 115
Using simple exponential smoothing and the following time series data, respond to each of the items.
Period
Demand
1
72
2
60
3
27
4
52
5
26
6
46
7
52
8
28
9
53
10
50
11
57
12
87
13
22
Show work, please. Thank you!
Using simple exponential smoothing and the following time series data, respond to each of the items.
Period
Demand
1
72
2
60
3
27
4
52
5
26
6
46
7
52
8
28
9
53
10
50
11
57
12
87
13
22
14
56
I need help! Please explain, thanks.
Chapter 14 Solutions
MyLab Statistics for Business Stats with Pearson eText -- Standalone Access Card -- for Statistics for Business and Economics
Ch. 14.1 - Explain in words how to construct a simple index.Ch. 14.1 - Explain in words how to calculate the following...Ch. 14.1 - Explain in words the difference between Laspeyres...Ch. 14.1 - The table below gives the prices for three...Ch. 14.1 - Refer to Exercise 14.4. The next table gives the...Ch. 14.1 - Annual median family income. The table below lists...Ch. 14.1 - Annual U.S. craft beer production. While overall...Ch. 14.1 - Quarterly single-family housing starts. The...Ch. 14.1 - Spot price of natural gas. The table shown in the...Ch. 14.1 - Employment in farm and nonfarm categories....
Ch. 14.1 - GOP personal consumption expenditures. The gross...Ch. 14.1 - GDP personal consumption expenditures (contd)....Ch. 14.1 - Weekly earnings for workers. The table in the next...Ch. 14.1 - Production and price of metals. The level or price...Ch. 14.2 - Describe the effect of selecting an exponential...Ch. 14.2 - A monthly time series is shown in the table to the...Ch. 14.2 - Annual U.S. craft beer production. Refer to the...Ch. 14.2 - Foreign fish production. Overfishing and pollution...Ch. 14.2 - Yearly price of gold. The price of gold is used by...Ch. 14.2 - Personal consumption in transportation. There has...Ch. 14.2 - OPEC crude oil imports. The data in the table...Ch. 14.2 - SP 500 Stock Index. Standard Poors 500 Composite...Ch. 14.5 - How does the choice of the smoothing constant w...Ch. 14.5 - Refer to Exercise 14.4 (p. 14-9). The table with...Ch. 14.5 - Annual U.S. craft beer production. Refer to...Ch. 14.5 - Quarterly single-family housing starts. Refer to...Ch. 14.5 - Consumer Price Index. The CPI measures the...Ch. 14.5 - OPEC crude oil imports. Refer to the annual OPEC...Ch. 14.5 - SP 500 Stock Index. Refer to the quarterly...Ch. 14.5 - SP 500 Stock Index (contd). Refer to Exercise...Ch. 14.5 - Monthly gold prices. The fluctuation of gold...Ch. 14.6 - Annual U.S. craft beer production. Refer to the...Ch. 14.6 - Annual U.S. craft beer production (contd). Refer...Ch. 14.6 - SP 500 Stock Index. Refer to your exponential...Ch. 14.6 - SP 500 Stock Index (contd). Refer to your Holt...Ch. 14.6 - Monthly gold prices. Refer to the monthly gold...Ch. 14.6 - US school enrollments. The next table reports...Ch. 14.8 - The annual price of a finished product (in cents...Ch. 14.8 - Retail sales in Quarters 14 over a 10-year period...Ch. 14.8 - What advantage do regression forecasts have over...Ch. 14.8 - Mortgage interest rates. The level at which...Ch. 14.8 - Price of natural gas. Refer to Exercise 14.9 (p....Ch. 14.8 - A gasoline tax on carbon emissions. In an effort...Ch. 14.8 - Predicting presidential elections. Researchers at...Ch. 14.8 - Life insurance policies in force. The table below...Ch. 14.8 - Graphing calculator sales. The next table presents...Ch. 14.8 - Prob. 14.47ACICh. 14.9 - Define autocorrelation. Explain why it is...Ch. 14.9 - For each case, indicate the decision regarding the...Ch. 14.9 - What do the following Durbin-Watson statistics...Ch. 14.9 - Company donations to charity. Refer to the Journal...Ch. 14.9 - Forecasting monthly car and truck sales. Forecasts...Ch. 14.9 - Predicting presidential elections. Refer to the...Ch. 14.9 - Mortgage interest rates. Refer to the data on...Ch. 14.9 - Price of natural gas. Refer to the annual data on...Ch. 14.9 - Life insurance policies in force. Refer to the...Ch. 14.9 - Modeling the deposit share of a retail bank....Ch. 14 - Insured Social Security workers. Workers insured...Ch. 14 - Insured Social Security workers (contd). Refer to...Ch. 14 - Retail prices of food items. In 1990, the average...Ch. 14 - Demand for emergency room services. With the...Ch. 14 - Mortgage interest rates. Refer to the annual...Ch. 14 - Price of Abbott Labs stock. The yearly closing...Ch. 14 - Price o f Abbott Labs stock (contd). Refer to...Ch. 14 - Prob. 14.65ACICh. 14 - Prob. 14.66ACICh. 14 - Quarterly GOP values (contd). Refer to Exercise...Ch. 14 - Prob. 14.68ACICh. 14 - Prob. 14.69ACICh. 14 - Prob. 14.70ACICh. 14 - IBM stock prices. Refer to Example 14.1 (p. 14-5)...Ch. 14 - Prob. 14.72ACI
Knowledge Booster


Learn more about
Need a deep-dive on the concept behind this application? Look no further. Learn more about this topic, statistics and related others by exploring similar questions and additional content below.Similar questions
- Number of Certified Organic Farmsin the United States, 2001–2008 Year Farms 2001 5,153 2002 5,454 2003 6,178 2004 6,150 2005 6,598 2006 7,486 2007 9,248 2008 11,043 Fit three trends (linear, quadratic, exponential) to the time series. (A negative value should be indicated by a minus sign. Do not round the intermediate calculations. Round your final answers to 2 decimal places.) Linear yt = xt + Quadratic yt = xt2+ xt + Exponential yt = e x Use each of the three fitted trend equations to make numerical forecasts for the next three years. (Round the intermediate calculations to 2 decimal places and round your final answers to 1 decimal place.) t Linear Exponential Quadratic 9 10 11arrow_forwardThe figure below shows the evolution of two different measures of inflation. Which of these series is showing the evolution of a measure of headline inflation, and which one is showing the evolution of a measure of underlying inflation? Justify your answer, and give an example of a measure of underlying inflation.arrow_forwardAn investor bought a 5 ½% bond at 99. Compute the current yield. (Round answer to two decimal places.)arrow_forward
- Number of Certified Organic Farms in the U.S., 2001-2008 Year Spending 2001 5497 2002 5895 2003 6570 2004 6547 2005 6980 2006 7857 2007 9486 2008 10698 Source: Statistical Abstract of the U.S., 2011, p. 537. Fit three trends (linear, quadratic, exponential) to the time series. (A negative value should be indicated by a minus sign. Do not round the intermediate calculations. Round your final answers to 2 decimal places.) Linear yt = xt + Quadratic yt = xt2+ xt + Exponential yt = e x (b) Use each of the three fitted trend equations to make numerical forecasts for the next three years. (Round the intermediate calculations to 2 decimal places and round your final answers to 1 decimal place.) t Linear Exponential Quadratic 9 10 11arrow_forwardTrue or false: In a Time-series plot, the vertical axis represents time.arrow_forwardHow are seasonal adjustments made in a time series analysis? Cyclical and Residual adjustments?arrow_forward
- Based on the time series plot in the attachment, answer the following questions. In these questions, it's sufficient to provide explanations and, if possible, write down the related equation with the required parameter(s). Don't attempt to calculate something. a. Identify the time components for this series. b. What kind of exponential smoothing model would be more appropriate for developing a forecast model for this time series? Explain why. c. How can this time series be deseasonalized by using moving average models?arrow_forwardWhat is the Simple Exponential Smoothing (SES) forecast with an alpha of .6 for period 4 is: (round to 2 decimal places) Week or X(Period) Time series value or Y(Sales) Forecast 14 214 37 410 515 612 7 ( don't hand writing solution)arrow_forwardUsing exponential smoothing, calculate the forecasts for months 2, 3, 4, 5, and 6. Thesmoothing constant is 0.2, and the old forecast for month 1 is 245.arrow_forward
- Consider the following observations of a series: Year 1 Year 2 Year 3 Year 4 94 114 154 164 a. Calculate the growth rates for Year 1–Year 2, Year 2–Year 3, and Year 3–Year 4. (Round your answers to 4 decimal places.) b. Calculate the average growth rate. (Enter your answer as a percentage, rounded to 2 decimal places, using intermediate calculations rounded to at least 4 decimal places.)arrow_forwardFind the order of growth of the following sum ? and what formula is used?arrow_forwardYou are offered an investment that will generate annual cash flows for 12 years starting one year from today. The expected amounts of these cash flows are given in the table below. What is the present value of this investment today if the annual interest rate is 10.9%? Year 1 2 3 4 5 6 7 8 9 10 11 12 Cashflow ($) 985 64 560 122 680 82 303 56 560 2arrow_forward
arrow_back_ios
SEE MORE QUESTIONS
arrow_forward_ios
Recommended textbooks for you
 Algebra & Trigonometry with Analytic GeometryAlgebraISBN:9781133382119Author:SwokowskiPublisher:Cengage
Algebra & Trigonometry with Analytic Geometry
Algebra
ISBN:9781133382119
Author:Swokowski
Publisher:Cengage
Time Series Analysis Theory & Uni-variate Forecasting Techniques; Author: Analytics University;https://www.youtube.com/watch?v=_X5q9FYLGxM;License: Standard YouTube License, CC-BY
Operations management 101: Time-series, forecasting introduction; Author: Brandoz Foltz;https://www.youtube.com/watch?v=EaqZP36ool8;License: Standard YouTube License, CC-BY