
Concept explainers
Videos
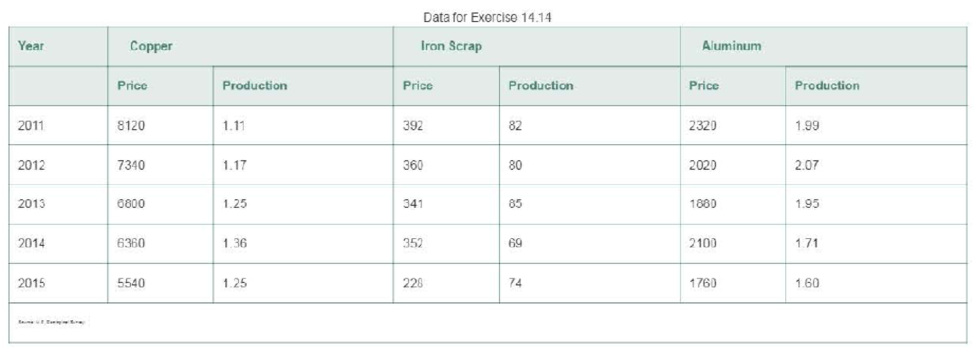
Production and price of metals. The level or price and production of metals in the United States is one measure of the strength of an industrial economy. The table at the bottom of the page lists the annual prices (in dollars per ton) and production (in millions of tons) for three metals—copper, aluminum, and iron scrap—from 2011 to 2015.
a. Compute the simple composite price and quantity indexes for the 5-year period, using 2011 as the base period.
b Compute the Laspeyres price index for the 5-year period, using 2011 as the base period.
c. Plot the simple composite and Laspeyres indexes on the same graph. Comment on the differences.
d Compute the Paasche price index for the 5-year period. using 2011 as the base period.
e. Plot the Paasche and Laspeyres indexes on the same graph. Comment on the differences.
f. Compare the Paasche and Laspeyres index values tor 2013 and 2015. Which index is more appropriate tor describing the change in this 2-year period? Explain.
Want to see the full answer?
Check out a sample textbook solution
Chapter 14 Solutions
MyLab Statistics for Business Stats with Pearson eText -- Standalone Access Card -- for Statistics for Business and Economics


 MATLAB: An Introduction with ApplicationsStatisticsISBN:9781119256830Author:Amos GilatPublisher:John Wiley & Sons Inc
 Probability and Statistics for Engineering and th...StatisticsISBN:9781305251809Author:Jay L. DevorePublisher:Cengage Learning
 Statistics for The Behavioral Sciences (MindTap C...StatisticsISBN:9781305504912Author:Frederick J Gravetter, Larry B. WallnauPublisher:Cengage Learning
 Elementary Statistics: Picturing the World (7th E...StatisticsISBN:9780134683416Author:Ron Larson, Betsy FarberPublisher:PEARSON
 The Basic Practice of StatisticsStatisticsISBN:9781319042578Author:David S. Moore, William I. Notz, Michael A. FlignerPublisher:W. H. Freeman
 Introduction to the Practice of StatisticsStatisticsISBN:9781319013387Author:David S. Moore, George P. McCabe, Bruce A. CraigPublisher:W. H. Freeman