
MyLab Statistics for Business Stats with Pearson eText -- Standalone Access Card -- for Statistics for Business and Economics
13th Edition
ISBN: 9780134748610
Author: James T. McClave, P. George Benson, Terry Sincich
Publisher: PEARSON
expand_more
expand_more
format_list_bulleted
Videos
Textbook Question
Chapter 14.2, Problem 14.22ACI
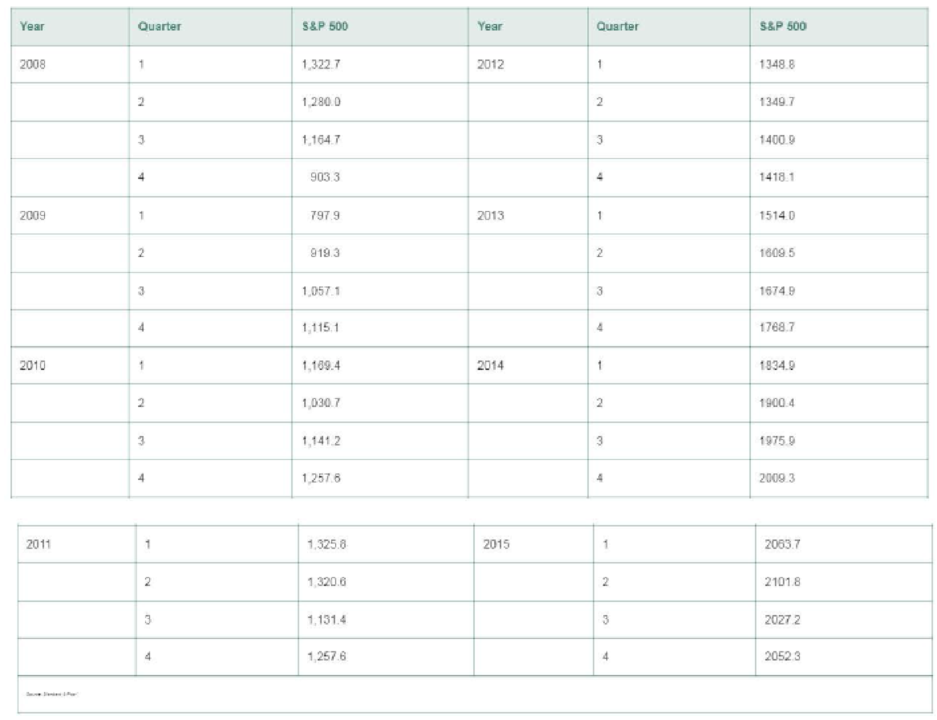
S&P 500 Stock Index. Standard & Poor’s 500 Composite Stock Index (S&P 500) is a stock market index. Like the Dow Jones Industrial Average, it is an indicator of stock market activity. The data in the table are end-of-quarter values of the S&P 500 for the years 2008-2015.
a. Calculate and plot the exponentially smoothed series for the quarterly S&P 500 using a smoothing constant of w = .3.
b. Repeat part a but use w = .7.
c. Which exponentially smoothed series do you prefer for describing trends in the series? Explain.
Expert Solution & Answer
Want to see the full answer?
Check out a sample textbook solution
Students have asked these similar questions
In many business applications, forecasts for future values of time series, such as sales and earnings, are made exclusively on the basis of past information on the time series in question. What features of time-series behavior are exploited in the production of such forecasts?
True or false: In a Time-series plot, the vertical axis represents time.
What do you mean by Time Series Analysis?
Chapter 14 Solutions
MyLab Statistics for Business Stats with Pearson eText -- Standalone Access Card -- for Statistics for Business and Economics
Ch. 14.1 - Explain in words how to construct a simple index.Ch. 14.1 - Explain in words how to calculate the following...Ch. 14.1 - Explain in words the difference between Laspeyres...Ch. 14.1 - The table below gives the prices for three...Ch. 14.1 - Refer to Exercise 14.4. The next table gives the...Ch. 14.1 - Annual median family income. The table below lists...Ch. 14.1 - Annual U.S. craft beer production. While overall...Ch. 14.1 - Quarterly single-family housing starts. The...Ch. 14.1 - Spot price of natural gas. The table shown in the...Ch. 14.1 - Employment in farm and nonfarm categories....
Ch. 14.1 - GOP personal consumption expenditures. The gross...Ch. 14.1 - GDP personal consumption expenditures (contd)....Ch. 14.1 - Weekly earnings for workers. The table in the next...Ch. 14.1 - Production and price of metals. The level or price...Ch. 14.2 - Describe the effect of selecting an exponential...Ch. 14.2 - A monthly time series is shown in the table to the...Ch. 14.2 - Annual U.S. craft beer production. Refer to the...Ch. 14.2 - Foreign fish production. Overfishing and pollution...Ch. 14.2 - Yearly price of gold. The price of gold is used by...Ch. 14.2 - Personal consumption in transportation. There has...Ch. 14.2 - OPEC crude oil imports. The data in the table...Ch. 14.2 - SP 500 Stock Index. Standard Poors 500 Composite...Ch. 14.5 - How does the choice of the smoothing constant w...Ch. 14.5 - Refer to Exercise 14.4 (p. 14-9). The table with...Ch. 14.5 - Annual U.S. craft beer production. Refer to...Ch. 14.5 - Quarterly single-family housing starts. Refer to...Ch. 14.5 - Consumer Price Index. The CPI measures the...Ch. 14.5 - OPEC crude oil imports. Refer to the annual OPEC...Ch. 14.5 - SP 500 Stock Index. Refer to the quarterly...Ch. 14.5 - SP 500 Stock Index (contd). Refer to Exercise...Ch. 14.5 - Monthly gold prices. The fluctuation of gold...Ch. 14.6 - Annual U.S. craft beer production. Refer to the...Ch. 14.6 - Annual U.S. craft beer production (contd). Refer...Ch. 14.6 - SP 500 Stock Index. Refer to your exponential...Ch. 14.6 - SP 500 Stock Index (contd). Refer to your Holt...Ch. 14.6 - Monthly gold prices. Refer to the monthly gold...Ch. 14.6 - US school enrollments. The next table reports...Ch. 14.8 - The annual price of a finished product (in cents...Ch. 14.8 - Retail sales in Quarters 14 over a 10-year period...Ch. 14.8 - What advantage do regression forecasts have over...Ch. 14.8 - Mortgage interest rates. The level at which...Ch. 14.8 - Price of natural gas. Refer to Exercise 14.9 (p....Ch. 14.8 - A gasoline tax on carbon emissions. In an effort...Ch. 14.8 - Predicting presidential elections. Researchers at...Ch. 14.8 - Life insurance policies in force. The table below...Ch. 14.8 - Graphing calculator sales. The next table presents...Ch. 14.8 - Prob. 14.47ACICh. 14.9 - Define autocorrelation. Explain why it is...Ch. 14.9 - For each case, indicate the decision regarding the...Ch. 14.9 - What do the following Durbin-Watson statistics...Ch. 14.9 - Company donations to charity. Refer to the Journal...Ch. 14.9 - Forecasting monthly car and truck sales. Forecasts...Ch. 14.9 - Predicting presidential elections. Refer to the...Ch. 14.9 - Mortgage interest rates. Refer to the data on...Ch. 14.9 - Price of natural gas. Refer to the annual data on...Ch. 14.9 - Life insurance policies in force. Refer to the...Ch. 14.9 - Modeling the deposit share of a retail bank....Ch. 14 - Insured Social Security workers. Workers insured...Ch. 14 - Insured Social Security workers (contd). Refer to...Ch. 14 - Retail prices of food items. In 1990, the average...Ch. 14 - Demand for emergency room services. With the...Ch. 14 - Mortgage interest rates. Refer to the annual...Ch. 14 - Price of Abbott Labs stock. The yearly closing...Ch. 14 - Price o f Abbott Labs stock (contd). Refer to...Ch. 14 - Prob. 14.65ACICh. 14 - Prob. 14.66ACICh. 14 - Quarterly GOP values (contd). Refer to Exercise...Ch. 14 - Prob. 14.68ACICh. 14 - Prob. 14.69ACICh. 14 - Prob. 14.70ACICh. 14 - IBM stock prices. Refer to Example 14.1 (p. 14-5)...Ch. 14 - Prob. 14.72ACI
Knowledge Booster


Learn more about
Need a deep-dive on the concept behind this application? Look no further. Learn more about this topic, statistics and related others by exploring similar questions and additional content below.Similar questions
- State the model used in time series analysis.arrow_forward(b) The following data represent the Coca-Cola's revenues (in $ hundred millions) during 2019-2022. Quarter 2019 2020 2021 2022 Oct-Dec Jan-Mar Apr-Jun Jul-Sep 44 56 55 49 45 53 54 49 41 54 53 48 45 57 58 52 (i) Plot the series in a line graph. Do you find any seasonal pattern? Calculate the seasonal index and interpret. (ii) Deseasonalized the data and fit a linear trend to the deseasonalized series. (iii)Obtain the deseasonalized forecasts and seasonal forecasts for 2023 revenues. In which quarter, the seasonal forecast has the most? The least? Is this logical? (iv) To estimate a regression model using seasonal binaries, set up a data set. If the estimated regression using seasonal binaries is given by Revenues = 48.31+ 0.12Time – 5.39 Qtr 1+ 5.74 Qtr 2+ 5.62 Qtr 3 Find the forecast the revenues for each quarter in 2023 and compare the forecasts in (iii).arrow_forwardThe figure below shows the evolution of two different measures of inflation. Which of these series is showing the evolution of a measure of headline inflation, and which one is showing the evolution of a measure of underlying inflation? Justify your answer, and give an example of a measure of underlying inflation.arrow_forward
- Which one of the following components represents the basic tendency of the series? a. Secular Trend b. Seasonal Variations c. Cyclic Variations d. Irregular Variationsarrow_forwardYear 10 Yr Inflation 20 Yr Bond Yield 1956 0.025814878 0.0345 1957 0.019835599 0.0323 1958 0.018893854 0.0382 1959 0.022195243 0.0447 1960 0.01787712 0.0380 1961 0.012678833 0.0415 1962 0.013016258 0.0395 1963 0.01403842 0.0417 1964 0.015728851 0.0423 1965 0.017275388 0.0450 1966 0.01777163 0.0455 1967 0.017790153 0.0556 1968 0.020756834 0.0598 1969 0.025364711 0.0687 1970 0.029381652 0.0648 1971 0.032067163 0.0597 1972 0.034253897 0.0599 1973 0.041402732 0.0726 1974 0.05241841 0.0760 1975 0.057507736 0.0805 1976 0.058964243 0.0721 1977 0.062688494 0.0803 1978 0.066992335 0.0898 1979 0.074192762 0.1012 1980 0.081095098 0.1199 1981 0.0866764 0.1334 1982 0.087135714 0.1095 1983 0.082136616 0.1197 1984 0.073938451 0.1170 1985 0.070644276 0.0956 1986 0.066962977 0.0789 1987 0.064604182 0.0920 1988 0.059994599 0.0918 1989 0.051328855 0.0816 1990 0.045045962 0.0844 1991 0.039173687 0.0730 1992 0.03820184 0.0726 1993…arrow_forwardfine the term DeComposite Series?arrow_forward
- 37 - The more than cumulative series graph of a classified frequency series is given below. What is the standard deviation value of the classified series?A) 44.39B) 44.16C) 43.61D) 45.42E) 43.17arrow_forwardThe following table shows the average life expectancies in several countries. Assume that all premiums you calculate are based on end-of-month deposits in a fund yielding 4.8% annual interest compounded monthly to be paid out when a person reaches the life expectancy. Country Japan Canada U.K. U.S. Mexico China India LifeExpectancy:Male 80 80 79 76 73 74 64 LifeExpectancy:Female 87 84 83 81 79 77 68 Calculate the life insurance monthly premium that a 40-year-old female in Japan would pay for a $5,000,000 policy. (Round your answer to the nearest cent.) $________arrow_forwardFor each of the following common patterns found in time series, identify a reasonableexample from the real-world that would likely exhibit this pattern.a. Horizontalb. Trendc. Seasonalityd. Cyclicalarrow_forward
arrow_back_ios
SEE MORE QUESTIONS
arrow_forward_ios
Recommended textbooks for you
 Algebra & Trigonometry with Analytic GeometryAlgebraISBN:9781133382119Author:SwokowskiPublisher:Cengage
Algebra & Trigonometry with Analytic Geometry
Algebra
ISBN:9781133382119
Author:Swokowski
Publisher:Cengage
Time Series Analysis Theory & Uni-variate Forecasting Techniques; Author: Analytics University;https://www.youtube.com/watch?v=_X5q9FYLGxM;License: Standard YouTube License, CC-BY
Operations management 101: Time-series, forecasting introduction; Author: Brandoz Foltz;https://www.youtube.com/watch?v=EaqZP36ool8;License: Standard YouTube License, CC-BY