
INTRODUCTION TO STATISTICS & DATA ANALYS
6th Edition
ISBN: 9780357420447
Author: PECK
Publisher: CENGAGE L
expand_more
expand_more
format_list_bulleted
Concept explainers
Videos
Textbook Question
Chapter 14.2, Problem 34E
This exercise requires the use of a statistical software package. The accompanying data resulted from a study of the relationship between y = Brightness of finished paper and the independent variables x1 = Hydrogen peroxide (% by weight), x2 = Sodium hydroxide (% by weight), x3 = Silicate (% by weight), and x4 = Process temperature (“Advantages of CE-HDP Bleaching for High Brightness Kraft Pulp Production,” TAPPI [1964]: 107A-173A).
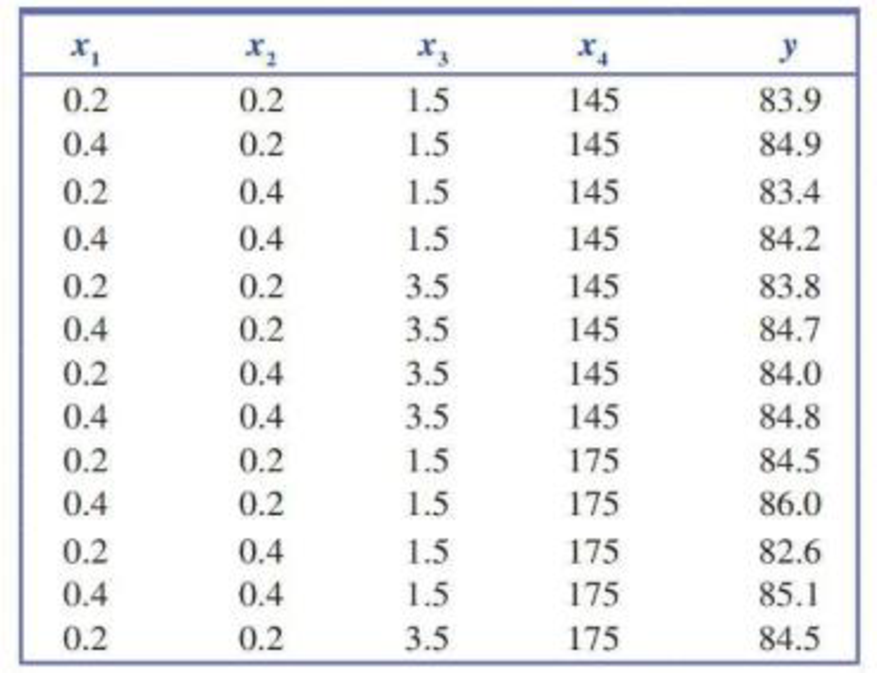
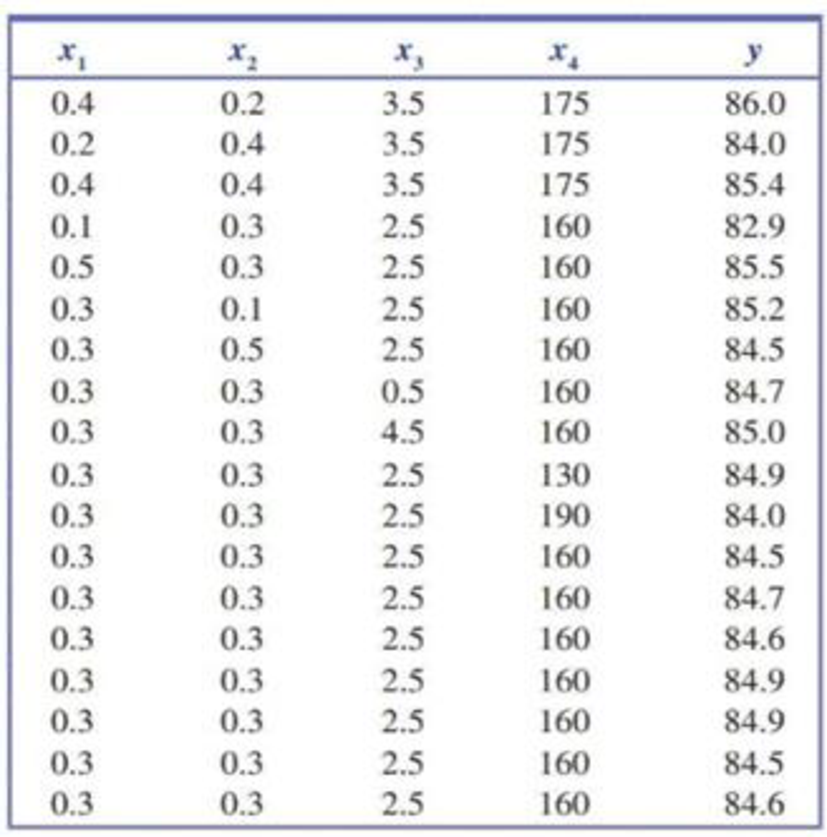
- a. Find the estimated regression equation for the model that includes all independent variables, all quadratic terms, and all interaction terms.
- b. Using a 0.05 significance level, carry out the model utility test.
- c. Interpret the values of the following quantities: SSResid, R2, and se.
Expert Solution & Answer
Want to see the full answer?
Check out a sample textbook solution
Students have asked these similar questions
In building an arena, steel bars with a mean ultimate tensile strength of 400 Megapascal (MPa) with a variance of 81 MPa were delivered by the manufactured. The project engineer tested 50 steel bars and found out that the mean ultimate tensile strength is 390 MPa. The decision for the extension of the contract with the manufacturer depends on the engineer. Test the hypothesis whether there is no significant difference between the two means using a two-tailed with a=0.01
The director of an obesity clinic in a large northwestern city believes that drinking soft drinks contribute to obesity in children. To determine whether a relationship exists between these two variables, she conducts the following pilot study. Eight- 12-year-old male volunteers are randomly selected from children attending a local junior high school. Parents of the children are asked to monitor the number of soft drinks consumed by their child over a one week period. The children are weighed at the end of the week and their weights converted into body mass index (BMI) values. The BMI is a common index used to measure obesity and takes into account both height and weight. An individual is considered obese if they have a BMI value 30. The following data or collected:
child. # of soft drinks consumed BMI
1 3 20
2 1 18
3…
If were regressing with an endogenous variable used as an independent variable, and employing the Multiple Indicator approach, can we test the assumptions required for the Betas to be "identified" and the Beta estimates to be "consistent"?
If so, what tests do we employ?
Chapter 14 Solutions
INTRODUCTION TO STATISTICS & DATA ANALYS
Ch. 14.1 - Prob. 1ECh. 14.1 - The authors of the paper Weight-Bearing Activity...Ch. 14.1 - Prob. 3ECh. 14.1 - Prob. 4ECh. 14.1 - Prob. 5ECh. 14.1 - Prob. 6ECh. 14.1 - Prob. 7ECh. 14.1 - Prob. 8ECh. 14.1 - Prob. 9ECh. 14.1 - The relationship between yield of maize (a type of...
Ch. 14.1 - Prob. 11ECh. 14.1 - A manufacturer of wood stoves collected data on y...Ch. 14.1 - Prob. 13ECh. 14.1 - Prob. 14ECh. 14.1 - Prob. 15ECh. 14.2 - Prob. 16ECh. 14.2 - State as much information as you can about the...Ch. 14.2 - Prob. 18ECh. 14.2 - Prob. 19ECh. 14.2 - Prob. 20ECh. 14.2 - The ability of ecologists to identify regions of...Ch. 14.2 - Prob. 22ECh. 14.2 - Prob. 23ECh. 14.2 - Prob. 24ECh. 14.2 - Prob. 25ECh. 14.2 - Prob. 26ECh. 14.2 - This exercise requires the use of a statistical...Ch. 14.2 - Prob. 28ECh. 14.2 - The article The Undrained Strength of Some Thawed...Ch. 14.2 - Prob. 30ECh. 14.2 - Prob. 31ECh. 14.2 - Prob. 32ECh. 14.2 - Prob. 33ECh. 14.2 - This exercise requires the use of a statistical...Ch. 14.2 - This exercise requires the use of a statistical...Ch. 14.3 - Prob. 36ECh. 14.3 - Prob. 37ECh. 14.3 - When Coastal power stations take in large amounts...Ch. 14.3 - Prob. 39ECh. 14.3 - The article first introduced in Exercise 14.28 of...Ch. 14.3 - Data from a random sample of 107 students taking a...Ch. 14.3 - Benevolence payments are monies collected by a...Ch. 14.3 - Prob. 43ECh. 14.3 - Prob. 44ECh. 14.3 - Prob. 45ECh. 14.3 - Prob. 46ECh. 14.3 - Exercise 14.26 gave data on fish weight, length,...Ch. 14.3 - Prob. 48ECh. 14.3 - Prob. 49ECh. 14.3 - Prob. 50ECh. 14.4 - Prob. 51ECh. 14.4 - Prob. 52ECh. 14.4 - The article The Analysis and Selection of...Ch. 14.4 - Prob. 54ECh. 14.4 - Prob. 55ECh. 14.4 - Prob. 57ECh. 14.4 - Prob. 58ECh. 14.4 - Prob. 59ECh. 14.4 - Prob. 60ECh. 14.4 - This exercise requires use of a statistical...Ch. 14.4 - Prob. 62ECh. 14 - Prob. 63CRCh. 14 - Prob. 64CRCh. 14 - The accompanying data on y = Glucose concentration...Ch. 14 - Much interest in management circles has focused on...Ch. 14 - Prob. 67CRCh. 14 - Prob. 68CRCh. 14 - Prob. 69CRCh. 14 - A study of pregnant grey seals resulted in n = 25...Ch. 14 - Prob. 71CRCh. 14 - Prob. 72CRCh. 14 - This exercise requires the use of a statistical...
Knowledge Booster


Learn more about
Need a deep-dive on the concept behind this application? Look no further. Learn more about this topic, statistics and related others by exploring similar questions and additional content below.Similar questions
- The director of marketing at Vanguard Corporation believes that sales of the company's Bright Side laundry detergent (S) are related to Vanguard's own advertising expenditures (A), as well as the combined advertising expenditures of its three biggest rival detergents (R).The marketing director collects 36 weekly observations on S, A, and R . Vanguard's marketing director is comfortable using parameter estimates that are statistically significant at the 10 percent level or better. Give the specific statistical tool that can be used to this problem.arrow_forwardKnight and Haslam (2010) found that office workers who had some input into the design of their office space were more productive and had higher well-being compared to workers for whom the office design was completely controlled by an office manager. For this study, identify the independent variable and the dependent variablearrow_forwardDuring the graphical analysis of the data below, two different curves were fitted to the data using the least squares method. The curves are as follows. Decide which curve is more suitable by calculating the correlation coefficients.arrow_forward
- Which of the following can cause OLS estimators to be biased?(i) Heteroskedasticity.(ii) Omitting an important variable.(iii) A sample correlation coefficient of .95 between two independent variables both included in the model.arrow_forward. The term sample usually refers to a sample that ___ - Consists of people with chemical dependency problems - Uses the same group of individuals with a before/after measurement - Requires a dependent variable for hypothesis testing - Is randomly selected from two dependent populationsarrow_forwardNight and Haslam 2010 found that office workers who had some input into the design of their office space were more productive and had higher well being compared to workers for whom the office designs was completely controlled by an office manager for this study identifying the independent variable and the dependent variablearrow_forward
- If Elliot collects data from a single sample and her dependent variable is assessed on a nominal scale, which of these difference tests would Elliot need to use to analyze her data? A. a single-sample t test B. a single-sample z test C. a between-subjects ANOVA D. a chi-square goodness-of-fit testarrow_forwardA milk processing company test implemented a plant-wide energy conservation program with a goal of reducing the mean daily consumption rate of at least 1,000 kWh from its normal operating plants. The conservation program was implemented in Plant B. The following data was collected on weekdays where consumption level is at its peak. Were the conservation efforts effective in achieving its goal? Compare the results with Plant A’s data where the program is not implemented using � = 0.05. Assume that the population variances are not equal.Plant A (kWh) Plant B (kWh)3,952.80 4,036.003,276.00 4,036.003,636.00 4,036.003,636.00 3,264.003,636.00 864.003,636.00 1,368.004,068.00 2,196.004,068.00 4,392.004,362.00 5,220.004,362.00 3,600.004,362.00 3,960.004,362.00 4,428.003,882.00 756.003,808.80 612.003,808.80 684.00arrow_forwardA survey of high school students was done to examine whether students had ever driven a car after consuming a substantial amount of alcohol (1=yes, 0=no). Data was collected on their sex (male/female), race (White/non-White), and grade level (9,10,11,12). Researchers realized that the impact of race on consuming alcohol before driving might vary by grade level and decided to fit the following model. Variable Coding = 1 if Intercept Sex () Female Race () Black Grade level ( 9th grade 10th grade 11th grade [Reference = 12th grade] Attached is the logistic model 1. Compute the OR of drinking before driving for students who self-reported as Black versus non-Black in the 9th grade, adjusting for gender. 2. Compute the OR of drinking before driving for students who self-reported as Black versus non-Black in the 12th grade, adjusting for gender. 3. Compute the OR of drinking before driving for someone in the 9th grade versus 12th grade for a student who…arrow_forward
- In building an arena, steel bars with a mean ultimate tensile strength of 400Megapascal (MPa) with a variance of 81 MPa were delivered by the manufacturer. The projectengineer tested 50 steel bars and found out that the mean ultimate tensile strength is 390 MPa.The decision for the extension of the contract with the manufacturer depends on the engineer.Test the hypothesis whether or not there is no significant difference between the two meansusing a two-tailed test with a = 0.01.arrow_forwardRecently, researchers have begun to focus on the relationship between potentially toxic environmental exposures in children to a number of adverse health outcomes. Suppose one such researcher wants to investigate the relationship between lead levels in soil (micrograms/dL) and BMI (kg/m2). The following table represents a SRS of households with the corresponding exterior lead levels and BMI of a randomly sampled child in the home. Lead levels BMI 13.6 19.7 14.3 19.9 9.7 20.1 9.4 22.1 11.4 19.8 10.9 21.6 A) Write out the null and alternative hypotheses for a formal test of significance testing the correlation between the two variables and calulate a t statistic and interpret your pvalue and results.arrow_forwardA milk processing company test implemented a plant-wide energy conservation program with a goal of reducing the mean daily consumption rate of at least 1,000 kWh from its normal operating plants. The conservation program was implemented in Plant B. The following data was collected on weekdays where consumption level is at its peak. Were the conservation efforts effective in achieving its goal? Compare the results with Plant A’s data where the program is not implemented using α= 0.05. Assume that the population variances are not equal.arrow_forward
arrow_back_ios
SEE MORE QUESTIONS
arrow_forward_ios
Recommended textbooks for you
 MATLAB: An Introduction with ApplicationsStatisticsISBN:9781119256830Author:Amos GilatPublisher:John Wiley & Sons Inc
 Probability and Statistics for Engineering and th...StatisticsISBN:9781305251809Author:Jay L. DevorePublisher:Cengage Learning
 Statistics for The Behavioral Sciences (MindTap C...StatisticsISBN:9781305504912Author:Frederick J Gravetter, Larry B. WallnauPublisher:Cengage Learning
 Elementary Statistics: Picturing the World (7th E...StatisticsISBN:9780134683416Author:Ron Larson, Betsy FarberPublisher:PEARSON
 The Basic Practice of StatisticsStatisticsISBN:9781319042578Author:David S. Moore, William I. Notz, Michael A. FlignerPublisher:W. H. Freeman
 Introduction to the Practice of StatisticsStatisticsISBN:9781319013387Author:David S. Moore, George P. McCabe, Bruce A. CraigPublisher:W. H. Freeman
MATLAB: An Introduction with Applications
Statistics
ISBN:9781119256830
Author:Amos Gilat
Publisher:John Wiley & Sons Inc
Probability and Statistics for Engineering and th...
Statistics
ISBN:9781305251809
Author:Jay L. Devore
Publisher:Cengage Learning
Statistics for The Behavioral Sciences (MindTap C...
Statistics
ISBN:9781305504912
Author:Frederick J Gravetter, Larry B. Wallnau
Publisher:Cengage Learning
Elementary Statistics: Picturing the World (7th E...
Statistics
ISBN:9780134683416
Author:Ron Larson, Betsy Farber
Publisher:PEARSON
The Basic Practice of Statistics
Statistics
ISBN:9781319042578
Author:David S. Moore, William I. Notz, Michael A. Fligner
Publisher:W. H. Freeman
Introduction to the Practice of Statistics
Statistics
ISBN:9781319013387
Author:David S. Moore, George P. McCabe, Bruce A. Craig
Publisher:W. H. Freeman
Correlation Vs Regression: Difference Between them with definition & Comparison Chart; Author: Key Differences;https://www.youtube.com/watch?v=Ou2QGSJVd0U;License: Standard YouTube License, CC-BY
Correlation and Regression: Concepts with Illustrative examples; Author: LEARN & APPLY : Lean and Six Sigma;https://www.youtube.com/watch?v=xTpHD5WLuoA;License: Standard YouTube License, CC-BY