
INTRODUCTION TO STATISTICS & DATA ANALYS
6th Edition
ISBN: 9780357420447
Author: PECK
Publisher: CENGAGE L
expand_more
expand_more
format_list_bulleted
Concept explainers
Videos
Textbook Question
Chapter 14.3, Problem 40E
The article first introduced in Exercise 14.28 of Section 14.2 in the textbook gave data on the dimensions of 27 representative food products. Use the multiple regression model fit in Exercise 14.28.
- a. Could any of the variables be eliminated from the estimated regression equation for predicting volume?
- b. Predict the volume of a package with a minimum width of 2.5 cm, a maximum width of 3.0 cm, and an elongation of 1.55.
- c. Calculate a 95% prediction interval for the volume of a package with a minimum width of 2.5 cm, a maximum width of 3.0 cm, and an elongation of 1.55.
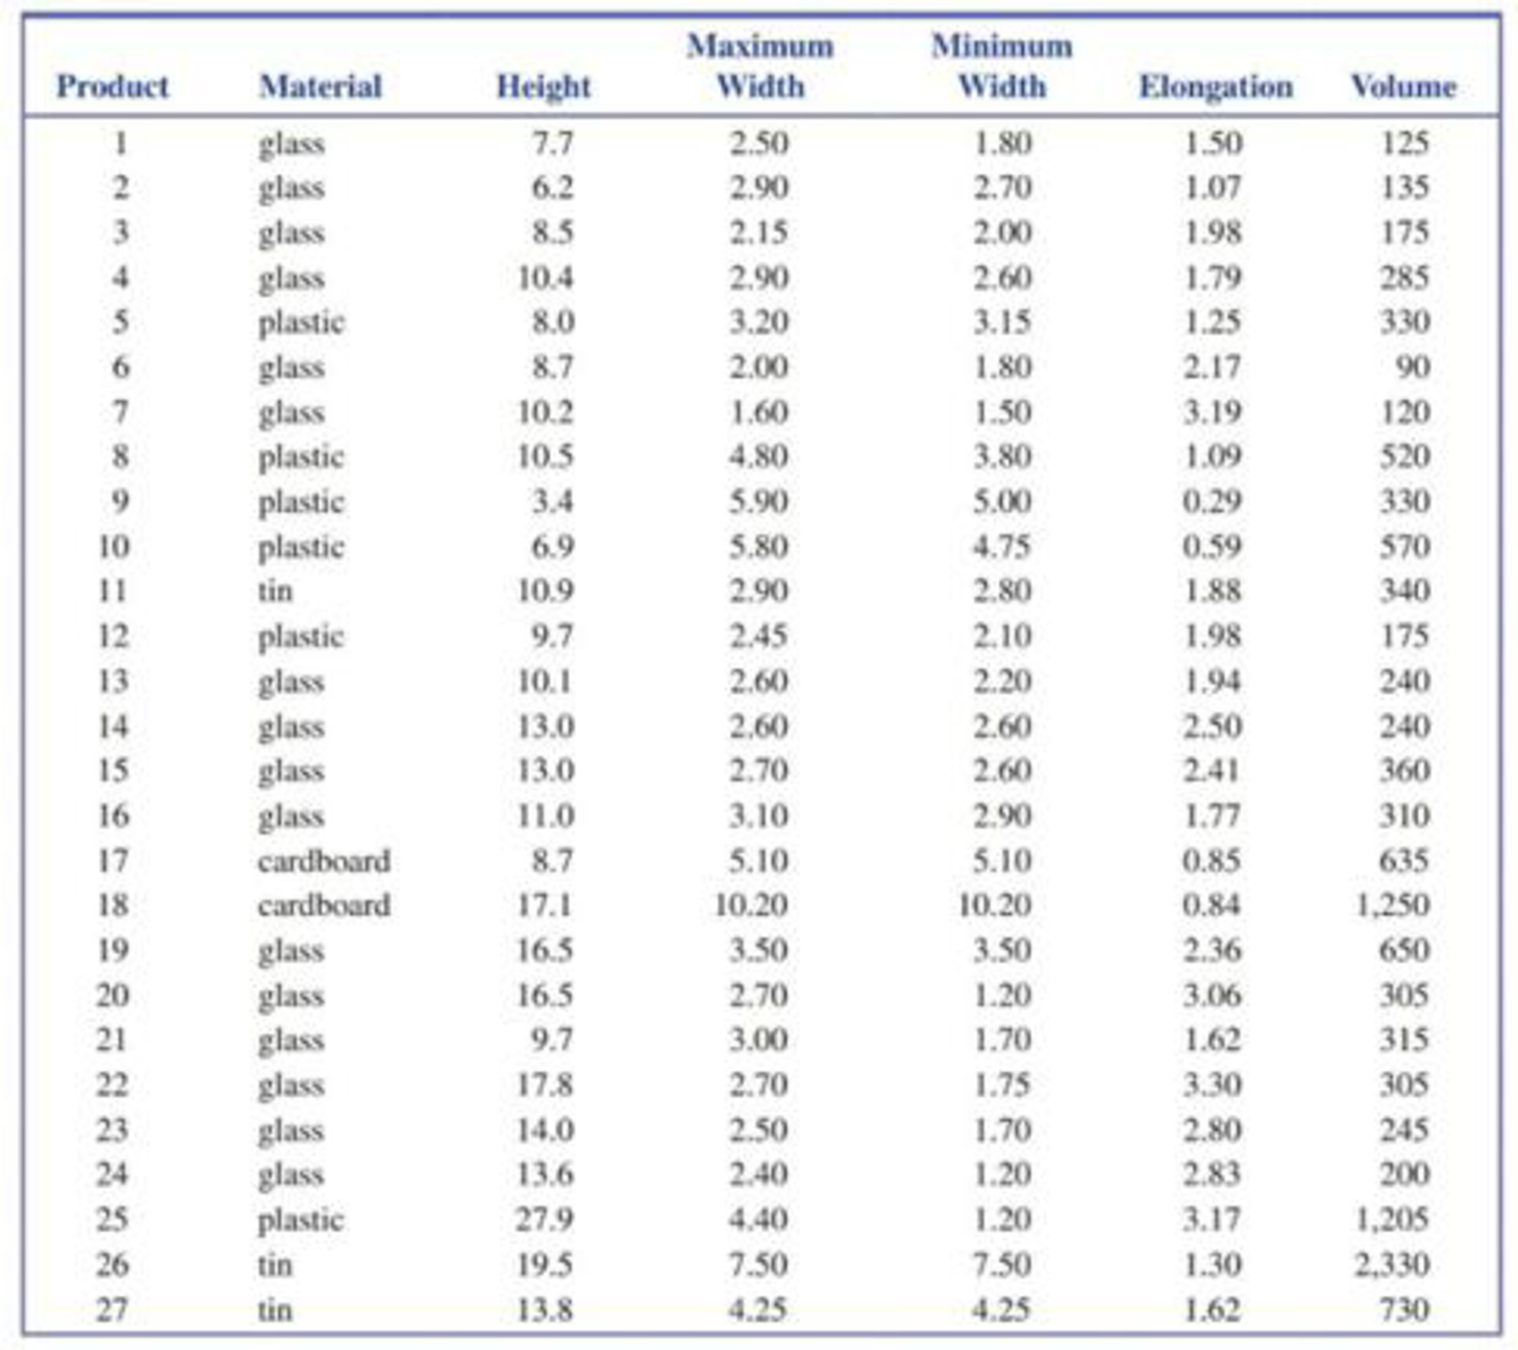
14.28 This exercise requires the use of a statistical software package. The article “Vital Dimensions in Volume Perception: Can the Eye Fool the Stomach?” (Journal of Marketing Research [1999]: 313-326) gave the data, shown in the table below, on dimensions of 27 representative food products.
- a. Fit a multiple regression model for predicting the volume (in ml) of a package based on its minimum width, maximum width, and elongation score.
- b. Why should we consider adjusted R: instead of R: when evaluating this model?
- c. Carry out a model utility F test.
Table for exercise 14.28
Expert Solution & Answer
Want to see the full answer?
Check out a sample textbook solution
Students have asked these similar questions
To fit a simple linear regression model to the data and to provide its equation (d = a*t + b), along with R2
Day
Date
Weekday
Daily Demand
Weekend
1
4/25/2016
Mon
297
0
2
4/26/2016
Tue
293
0
3
4/27/2016
Wed
327
0
4
4/28/2016
Thu
315
0
5
4/29/2016
Fri
348
0
6
4/30/2016
Sat
447
1
7
5/1/2016
Sun
431
1
8
5/2/2016
Mon
283
0
9
5/3/2016
Tue
326
0
10
5/4/2016
Wed
317
0
11
5/5/2016
Thu
345
0
12
5/6/2016
Fri
355
0
13
5/7/2016
Sat
428
1
14
5/8/2016
Sun
454
1
15
5/9/2016
Mon
305
0
16
5/10/2016
Tue
310
0
17
5/11/2016
Wed
350
0
18
5/12/2016
Thu
308
0
19
5/13/2016
Fri
366
0
20
5/14/2016
Sat
460
1
21
5/15/2016
Sun
427
1
22
5/16/2016
Mon
291
0
23
5/17/2016
Tue
325
0
24
5/18/2016
Wed
354
0
25
5/19/2016
Thu
322
0
26
5/20/2016
Fri
405
0
27
5/21/2016
Sat
442
1
28
5/22/2016
Sun
454
1
29
5/23/2016
Mon
318
0
30
5/24/2016
Tue
298
0
31
5/25/2016
Wed
355
0
32
5/26/2016
Thu
355
0
33
5/27/2016
Fri
374
0
34
5/28/2016
Sat
447
1
35
5/29/2016…
If the general linear regression model is given by the equation: y = a + b?; considering the informationobtained in Figure 2 above, compute the value of a.
.The worker has noticed that the more time he spends at work (x), the less money he is likely to make (y) in conducting transactions for his firm. Which of the regression equations MOST suggests such a possibility?
Chapter 14 Solutions
INTRODUCTION TO STATISTICS & DATA ANALYS
Ch. 14.1 - Prob. 1ECh. 14.1 - The authors of the paper Weight-Bearing Activity...Ch. 14.1 - Prob. 3ECh. 14.1 - Prob. 4ECh. 14.1 - Prob. 5ECh. 14.1 - Prob. 6ECh. 14.1 - Prob. 7ECh. 14.1 - Prob. 8ECh. 14.1 - Prob. 9ECh. 14.1 - The relationship between yield of maize (a type of...
Ch. 14.1 - Prob. 11ECh. 14.1 - A manufacturer of wood stoves collected data on y...Ch. 14.1 - Prob. 13ECh. 14.1 - Prob. 14ECh. 14.1 - Prob. 15ECh. 14.2 - Prob. 16ECh. 14.2 - State as much information as you can about the...Ch. 14.2 - Prob. 18ECh. 14.2 - Prob. 19ECh. 14.2 - Prob. 20ECh. 14.2 - The ability of ecologists to identify regions of...Ch. 14.2 - Prob. 22ECh. 14.2 - Prob. 23ECh. 14.2 - Prob. 24ECh. 14.2 - Prob. 25ECh. 14.2 - Prob. 26ECh. 14.2 - This exercise requires the use of a statistical...Ch. 14.2 - Prob. 28ECh. 14.2 - The article The Undrained Strength of Some Thawed...Ch. 14.2 - Prob. 30ECh. 14.2 - Prob. 31ECh. 14.2 - Prob. 32ECh. 14.2 - Prob. 33ECh. 14.2 - This exercise requires the use of a statistical...Ch. 14.2 - This exercise requires the use of a statistical...Ch. 14.3 - Prob. 36ECh. 14.3 - Prob. 37ECh. 14.3 - When Coastal power stations take in large amounts...Ch. 14.3 - Prob. 39ECh. 14.3 - The article first introduced in Exercise 14.28 of...Ch. 14.3 - Data from a random sample of 107 students taking a...Ch. 14.3 - Benevolence payments are monies collected by a...Ch. 14.3 - Prob. 43ECh. 14.3 - Prob. 44ECh. 14.3 - Prob. 45ECh. 14.3 - Prob. 46ECh. 14.3 - Exercise 14.26 gave data on fish weight, length,...Ch. 14.3 - Prob. 48ECh. 14.3 - Prob. 49ECh. 14.3 - Prob. 50ECh. 14.4 - Prob. 51ECh. 14.4 - Prob. 52ECh. 14.4 - The article The Analysis and Selection of...Ch. 14.4 - Prob. 54ECh. 14.4 - Prob. 55ECh. 14.4 - Prob. 57ECh. 14.4 - Prob. 58ECh. 14.4 - Prob. 59ECh. 14.4 - Prob. 60ECh. 14.4 - This exercise requires use of a statistical...Ch. 14.4 - Prob. 62ECh. 14 - Prob. 63CRCh. 14 - Prob. 64CRCh. 14 - The accompanying data on y = Glucose concentration...Ch. 14 - Much interest in management circles has focused on...Ch. 14 - Prob. 67CRCh. 14 - Prob. 68CRCh. 14 - Prob. 69CRCh. 14 - A study of pregnant grey seals resulted in n = 25...Ch. 14 - Prob. 71CRCh. 14 - Prob. 72CRCh. 14 - This exercise requires the use of a statistical...
Knowledge Booster


Learn more about
Need a deep-dive on the concept behind this application? Look no further. Learn more about this topic, statistics and related others by exploring similar questions and additional content below.Similar questions
- Olympic Pole Vault The graph in Figure 7 indicates that in recent years the winning Olympic men’s pole vault height has fallen below the value predicted by the regression line in Example 2. This might have occurred because when the pole vault was a new event there was much room for improvement in vaulters’ performances, whereas now even the best training can produce only incremental advances. Let’s see whether concentrating on more recent results gives a better predictor of future records. (a) Use the data in Table 2 (page 176) to complete the table of winning pole vault heights shown in the margin. (Note that we are using x=0 to correspond to the year 1972, where this restricted data set begins.) (b) Find the regression line for the data in part ‚(a). (c) Plot the data and the regression line on the same axes. Does the regression line seem to provide a good model for the data? (d) What does the regression line predict as the winning pole vault height for the 2012 Olympics? Compare this predicted value to the actual 2012 winning height of 5.97 m, as described on page 177. Has this new regression line provided a better prediction than the line in Example 2?arrow_forwardA researcher notes that, in a certain region, a disproportionate number of software millionaires were born around the year 1955. Is this a coincidence, or does birth year matter when gauging whether a software founder will besuccessful? The researcher investigated this question by analyzing the data shown in the accompanying table. Complete parts a through c below. a. Find the coefficient of determination for the simple linear regression model relating number (y) of software millionaire birthdays in a decade to total number (x) of births in the region. Interpret the result. The coefficient of determination is 1.___? (Round to three decimal places as needed.) This value indicates that 2.____ of the sample variation in the number of software millionaire birthdays is explained by the linear relationship with the total number of births in the region. (Round to one decimal place as needed.) b. Find the coefficient of determination for the simple linear regression model…arrow_forwardConsider the following estimated regression model relating annual salary to years of education and work experience. Estimated Salary=10,815.11+2563.46(Education)+897.49(Experience)Estimated Salary=10,815.11+2563.46(Education)+897.49(Experience) Suppose two employees at the company have been working there for five years. One has a bachelor's degree (88 years of education) and one has a master's degree (1010 years of education). How much more money would we expect the employee with a master's degree to make?arrow_forward
- he following table shows the annual number of PhD graduates in a country in various fields. NaturalSciences Engineering SocialSciences Education 1990 70 10 60 30 1995 130 40 100 50 2000 330 130 280 140 2005 490 370 460 210 2010 590 550 830 520 2012 690 590 1,000 900 (a)With x = the number of social science doctorates and y = the number of education doctorates, use technology to obtain the regression equation. (Round coefficients to three significant digits.) y(x) = Use technology to obtain the coefficient of correlation r. (Round your answer to three decimal places.) r =arrow_forwardCreate the regression equations based on the research model below!arrow_forwardThe following table shows the annual number of PhD graduates in a country in various fields. NaturalSciences Engineering SocialSciences Education 1990 70 10 60 30 1995 130 40 100 50 2000 330 130 280 120 2005 490 370 460 210 2010 590 550 830 520 2012 690 590 1,000 900 (a) With x = the number of social science doctorates and y = the number of education doctorates, use technology to obtain the regression equation. (Round coefficients to three significant digits.) y(x) = What does the slope tell you about the relationship between the number of social science doctorates and the number of education doctorates? The slope tells us the increase in the number of education doctorates for each additional social science doctorate. The slope tells us the decrease in the number of social science doctorates for each additional education doctorate. The slope tells us the increase in the number of social science doctorates for each additional education doctorate.…arrow_forward
- Consider the following estimated regression model relating annual salary to years of education and work experience. Estimated Salary=10,737.30+2872.43(Education)+1129.1(Experience)Estimated Salary=10,737.30+2872.43(Education)+1129.1(Experience) Suppose an employee with 44 years of education has been with the company for 1111 years (note that education years are the number of years after 8th8th grade). According to this model, what is his estimated annual salary?arrow_forwardA multiple linear regression model based on a sample of 13 weeks is developed to predict standby hours based on the total staff present and remote hours. The SSR is 23,638.17 and the SSE is 33,273.99. c. Compute the coefficient of multiple determination, r2, and interpret its meaning. (Round to four decimal places as needed.)arrow_forwardA U.S. state's Bureau of Economic Geology published a study on the economic impact of using carbon dioxide enhanced oil recovery (EOR) technology to extract additional oil from fields that have reached the end of their conventional economic life. The following table gives the approximate number of jobs for the citizens that would be created at various levels of recovery. Percent Recovery (%) 20 40 80 100 Jobs Created (Millions) 6 9 12 18 Find the regression line. j(r) = Use the regression line to estimate the number of jobs that would be created at a recovery level of 60%. _____ million jobsarrow_forward
- Consider the following table containing unemployment rates for a 10-year period. Unemployment Rates Year Unemployment Rate (%) 1 5.85.8 2 3.23.2 3 5.55.5 4 8.68.6 5 6.16.1 6 6.86.8 7 7.57.5 8 5.25.2 9 11.111.1 10 7.47.4 Step 1 of 2 : Given the model Estimated Unemployment Rate=β0+β1(Year)+εi,Estimated Unemployment Rate=�0+�1(Year)+��, write the estimated regression equation using the least squares estimates for β0�0 and β1�1. Round your answers to two decimal places.arrow_forwardConsider the following linear regression model that relates income per capita in thousand dollars of a country i (GDP P Ci), with its percentage of the population in the agricultural sector (P Ai): Model : GDP P Ci = β0 + β1P Ai + ui (a) Explain in words how to interpret parameters β0 and β1. What sign do you think these parameters might have? Explain. (b) Draw the (population) regression line associated with this model assuming that parameters β0 and β1 have the sign you have indicated in answering question (2a). Explain the meaning of this regression line.arrow_forwardThe following table shows the annual number of PhD graduates in a country in various fields. NaturalSciences Engineering SocialSciences Education 1990 70 10 60 30 1995 130 40 120 40 2000 330 130 280 120 2005 490 370 460 210 2010 590 550 830 520 2012 690 590 1,000 900 (a)With x = the number of social science doctorates and y = the number of education doctorates, use technology to obtain the regression equation. (Round coefficients to three significant digits.) y(x) =arrow_forward
arrow_back_ios
SEE MORE QUESTIONS
arrow_forward_ios
Recommended textbooks for you
 College AlgebraAlgebraISBN:9781305115545Author:James Stewart, Lothar Redlin, Saleem WatsonPublisher:Cengage Learning
 Linear Algebra: A Modern IntroductionAlgebraISBN:9781285463247Author:David PoolePublisher:Cengage Learning
 Functions and Change: A Modeling Approach to Coll...AlgebraISBN:9781337111348Author:Bruce Crauder, Benny Evans, Alan NoellPublisher:Cengage Learning
 Algebra & Trigonometry with Analytic GeometryAlgebraISBN:9781133382119Author:SwokowskiPublisher:Cengage
College Algebra
Algebra
ISBN:9781305115545
Author:James Stewart, Lothar Redlin, Saleem Watson
Publisher:Cengage Learning
Linear Algebra: A Modern Introduction
Algebra
ISBN:9781285463247
Author:David Poole
Publisher:Cengage Learning
Functions and Change: A Modeling Approach to Coll...
Algebra
ISBN:9781337111348
Author:Bruce Crauder, Benny Evans, Alan Noell
Publisher:Cengage Learning
Algebra & Trigonometry with Analytic Geometry
Algebra
ISBN:9781133382119
Author:Swokowski
Publisher:Cengage
Correlation Vs Regression: Difference Between them with definition & Comparison Chart; Author: Key Differences;https://www.youtube.com/watch?v=Ou2QGSJVd0U;License: Standard YouTube License, CC-BY
Correlation and Regression: Concepts with Illustrative examples; Author: LEARN & APPLY : Lean and Six Sigma;https://www.youtube.com/watch?v=xTpHD5WLuoA;License: Standard YouTube License, CC-BY