
INTRODUCTION TO STATISTICS & DATA ANALYS
6th Edition
ISBN: 9780357420447
Author: PECK
Publisher: CENGAGE L
expand_more
expand_more
format_list_bulleted
Concept explainers
Videos
Textbook Question
Chapter 14, Problem 70CR
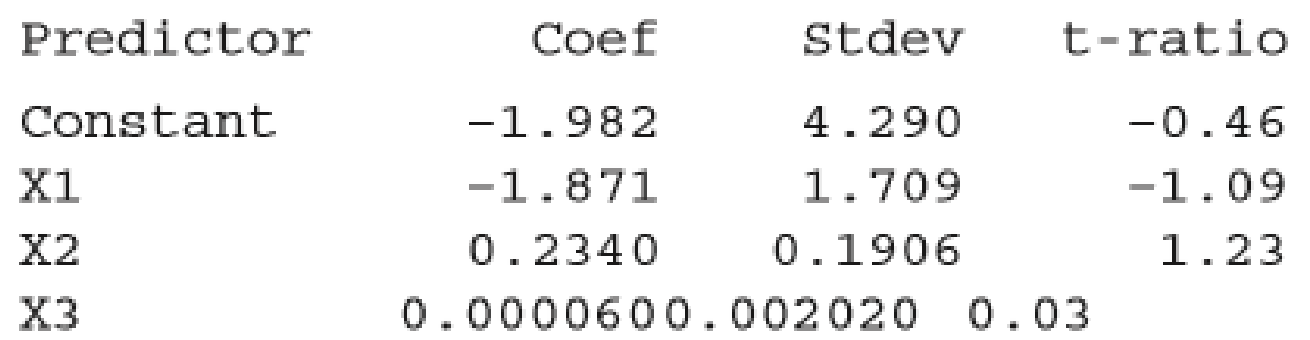
A study of pregnant grey seals resulted in n = 25 observations on the variables y = Fetus progesterone level (mg), x1 = Felus sex (0 = male, 1 = female), x2 = Fetus length (cm), and x3 = Fetus weight (g). Minitab output for the model using all three independent variables is given (“Gonadotropin and Progesterone Concentration in Placenta of Grey Seals,” Journal of Reproduction and Fertility [1984]: 521–528).
The regression equation is Y = −1.98 − 1.87X1 + .234X2 + .0001X3
s = 4.189 R-sq = 55.2% R-sq(adj) = 48.8%
Analysis of Variance
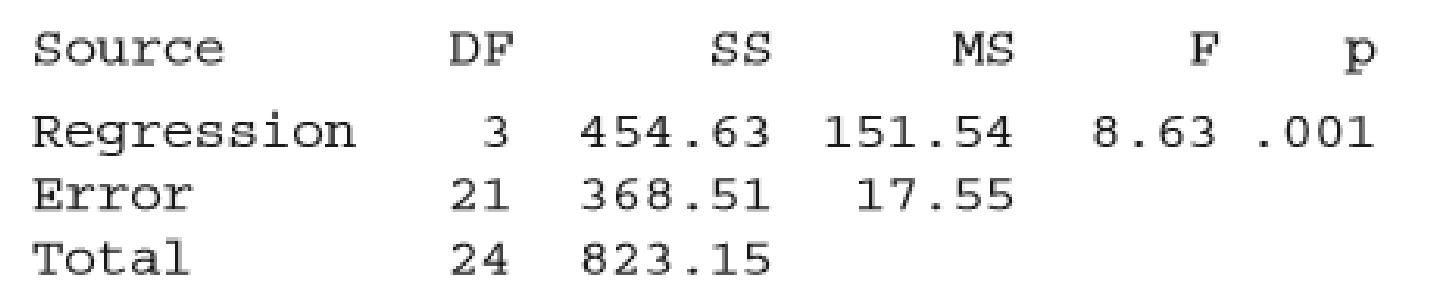
- a. Use information from the Minitab output to test the hypothesis H0: β1 = β2 = β3 = 0.
- b. Using an elimination criterion of −2 ≤ t ratio ≤ 2, should any variable be eliminated? If so, which one?
- c. Minitab output for the regression using only x1 = Sex and x2 = Length is given. Would you recommend keeping both and x2 in the model? Explain.
The regression equation is Y = −2.09 − 1.87X1 + .240X2
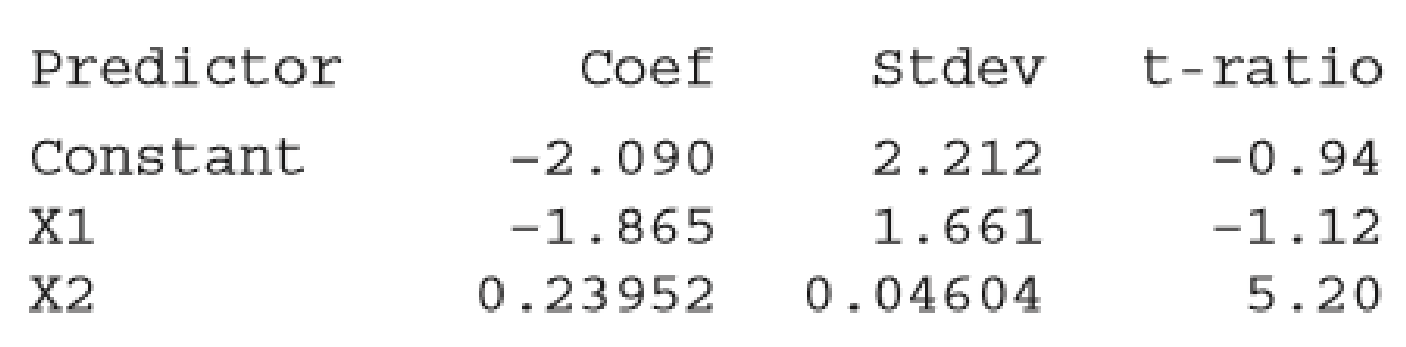
s = 4.093 R-sq = 55.2% R-sq(adj) = 51.2%
- d. After elimination of both x3 and x1, the estimated regression equation is ŷ = −2.61 + 0.231x2. The corresponding values of R2 and se are 0.527 and 4.116, respectively. Interpret these values.
- e. Referring to Part (d), how would you interpret the value of b2 = 0.231? Does it make sense to interpret the value of a as the estimate of average progesterone level when length is zero? Explain.
Expert Solution & Answer
Want to see the full answer?
Check out a sample textbook solution
Students have asked these similar questions
The coefficients in a distributed lag regression of Y on X and its lags can be interpreted as the dynamic causal effects when the time path of X is determined randomly and independently of other factors that influence Y. Explain How?
why is the DV female drosophila
Do you use a z or test for this problem?
A multiple regression includes two regressors: Yi = b0 + b1X1i +b2X2i + ui. What is the expected change in Y if X1 increases by 8 unitsand X2 is unchanged? What is the expected change in Y if X2 decreasesby 3 units and X1 is unchanged? What is the expected change in Y if X1increases by 4 units and X2 decreases by 7 units?
Chapter 14 Solutions
INTRODUCTION TO STATISTICS & DATA ANALYS
Ch. 14.1 - Prob. 1ECh. 14.1 - The authors of the paper Weight-Bearing Activity...Ch. 14.1 - Prob. 3ECh. 14.1 - Prob. 4ECh. 14.1 - Prob. 5ECh. 14.1 - Prob. 6ECh. 14.1 - Prob. 7ECh. 14.1 - Prob. 8ECh. 14.1 - Prob. 9ECh. 14.1 - The relationship between yield of maize (a type of...
Ch. 14.1 - Prob. 11ECh. 14.1 - A manufacturer of wood stoves collected data on y...Ch. 14.1 - Prob. 13ECh. 14.1 - Prob. 14ECh. 14.1 - Prob. 15ECh. 14.2 - Prob. 16ECh. 14.2 - State as much information as you can about the...Ch. 14.2 - Prob. 18ECh. 14.2 - Prob. 19ECh. 14.2 - Prob. 20ECh. 14.2 - The ability of ecologists to identify regions of...Ch. 14.2 - Prob. 22ECh. 14.2 - Prob. 23ECh. 14.2 - Prob. 24ECh. 14.2 - Prob. 25ECh. 14.2 - Prob. 26ECh. 14.2 - This exercise requires the use of a statistical...Ch. 14.2 - Prob. 28ECh. 14.2 - The article The Undrained Strength of Some Thawed...Ch. 14.2 - Prob. 30ECh. 14.2 - Prob. 31ECh. 14.2 - Prob. 32ECh. 14.2 - Prob. 33ECh. 14.2 - This exercise requires the use of a statistical...Ch. 14.2 - This exercise requires the use of a statistical...Ch. 14.3 - Prob. 36ECh. 14.3 - Prob. 37ECh. 14.3 - When Coastal power stations take in large amounts...Ch. 14.3 - Prob. 39ECh. 14.3 - The article first introduced in Exercise 14.28 of...Ch. 14.3 - Data from a random sample of 107 students taking a...Ch. 14.3 - Benevolence payments are monies collected by a...Ch. 14.3 - Prob. 43ECh. 14.3 - Prob. 44ECh. 14.3 - Prob. 45ECh. 14.3 - Prob. 46ECh. 14.3 - Exercise 14.26 gave data on fish weight, length,...Ch. 14.3 - Prob. 48ECh. 14.3 - Prob. 49ECh. 14.3 - Prob. 50ECh. 14.4 - Prob. 51ECh. 14.4 - Prob. 52ECh. 14.4 - The article The Analysis and Selection of...Ch. 14.4 - Prob. 54ECh. 14.4 - Prob. 55ECh. 14.4 - Prob. 57ECh. 14.4 - Prob. 58ECh. 14.4 - Prob. 59ECh. 14.4 - Prob. 60ECh. 14.4 - This exercise requires use of a statistical...Ch. 14.4 - Prob. 62ECh. 14 - Prob. 63CRCh. 14 - Prob. 64CRCh. 14 - The accompanying data on y = Glucose concentration...Ch. 14 - Much interest in management circles has focused on...Ch. 14 - Prob. 67CRCh. 14 - Prob. 68CRCh. 14 - Prob. 69CRCh. 14 - A study of pregnant grey seals resulted in n = 25...Ch. 14 - Prob. 71CRCh. 14 - Prob. 72CRCh. 14 - This exercise requires the use of a statistical...
Knowledge Booster


Learn more about
Need a deep-dive on the concept behind this application? Look no further. Learn more about this topic, statistics and related others by exploring similar questions and additional content below.Similar questions
- The director of an obesity clinic in a large northwestern city believes that drinking soft drinks contribute to obesity in children. To determine whether a relationship exists between these two variables, she conducts the following pilot study. Eight- 12-year-old male volunteers are randomly selected from children attending a local junior high school. Parents of the children are asked to monitor the number of soft drinks consumed by their child over a one week period. The children are weighed at the end of the week and their weights converted into body mass index (BMI) values. The BMI is a common index used to measure obesity and takes into account both height and weight. An individual is considered obese if they have a BMI value 30. The following data or collected: child. # of soft drinks consumed BMI 1 3 20 2 1 18 3…arrow_forwardA researcher was investigating variables that might be associated with the academic performance of high school students. The data included the average Math SAS score of all high school seniors in the city that took the exam (labeled as the variable SAT-M), the average number of dollars per pupil spent on education by the city (labeled as the variable $Per Pupil), and the percentage of high school seniors in the city that took the exam (labeled as the variable %Taking). The researcher ran the following multiple linear regression model as SAT-M=Beta0 + Beta1($Per Pupil) + Beta2(%Taking). This model was fit to the data using the method of least-squares, results shown inside of table within photo. If we want to test using ANOVA F-test with hypotheses Ho: Beta1=Beta2=0 versus H1: at least one of the Beta is not 0, what would the value of our F-statistic mean?arrow_forwardIs CEO compensation related to a company's performance? To test whether CEO compensation and a company's stock performance are related, a financial analyst collected data on 12 randomly selected, publicly traded companies. For each company, the analyst looked at two variables: the percent change in stock price over the past five years (which she denoted x ) and the percent change in CEO compensation over the past five years (which she denoted y ). For these 12 companies, the least-squares regression equation relating the two variables was =y+−0.1650.046x , and the standard error of the slope of this least-squares regression line was approximately 0.028 . Using her information, test for a significant linear relationship between these two variables by doing a hypothesis test regarding the population slope β1 . (Assume that the variable y follows a normal distribution for each value of x and that the other regression assumptions are satisfied.) Use the…arrow_forward
- In recent years, concerns have been expressed about adverse health effects from amalgam dental restorations, which include mercury. The table below shows results from a study in which some patients were treated with amalgam restorations and others were treated with composite restorations that do not contain mercury (based on data from “Neuropsychological and Renal Effects of Dental Amalgam in Children,” by Bellinger, et al., Journal of the American Medical Association, Vol. 295, No. 15). Use a 0.05 significance level to test for independence between the type of restoration and sensory disorders. Do amalgam restorations appear to affect sensory disorders? Amalgam Composite Sensory disorder 36 28 No sensory disorder 231 239arrow_forwardThe least-squares regression line relating two statistical variables is given as = 24 + 5x. Compute the residual if the actual (observed) value for y is 38 when x is 2. 4 38 2arrow_forwardAssuming the model is re-estimated with additional new variable (lagged of LGDP), based on the new estimated results, what is your conclusion about the autocorrelation diagnostic test? If there is diagnostic problem, show how to solve the problem.arrow_forward
- A research on the effect of duodenal infusion of donor feces for recurrent Clostridium difficile examined patients with C. difficile infections which cause persistent diarrhea. Some patients were given the antibiotic vancomycin, while others were given a fecal transplant. At alpha = 0.01, test if the result is dependent on the type of treatment given.arrow_forwardIf the data is highly skewed, can we still rely on the kurtosis coefficient? Why or why not?arrow_forwardAn econometrician suspects that the residuals of her model might be autocorrelated. Explain the steps involved in testing this theory using the Durbin–Watson (DW) testarrow_forward
- If I want to estimate the regression of a model by using OLS on Eveiws , and I chose the "keep it as general as possible" approach, what tests can I apply through the estimation and inference process to validate the model and the variables?arrow_forward. A new chemotherapy drug is released to treat leukemia and researchers suspect that the drug may have fewer side effects than the most commonly used drug to treat leukemia. The two drugs have equivalent efficacy. In order to determine if a larger study should be conducted to look into the prevalence of side effects for the two drugs, set up a Mann-Whitney U test at the alpha equals .05 level and interpret its results. Number of Reported Side-Effects Old Drug 0 1 3 3 5 New Drug 0 0 1 2 4 Old Drug New Drug Total Sample (Ordered Smallest to Largest) Ranks Old Drug New Drug Old Drug New Drug 0 0 0 0 2 2 1 0 1 0 4.5 2 3 1 3 1 7.5 4.5 3 2 3 2 7.5 6 5 4 5 4 10 9 Total R1=31.5 R2=23.5 A) We…arrow_forwardA new chemotherapy drug is released to treat leukemia and researchers suspect that the drug may have fewer side effects than the most commonly used drug to treat leukemia. The two drugs have equivalent efficacy. In order to determine if a larger study should be conducted to look into the prevalence of side effects for the two drugs, set up a Mann-Whitney U test at the alpha equals .05 level and interpret its results. Number of Reported Side-Effects Old Drug 0 1 3 3 5 New Drug 0 0 1 2 4 Old Drug New Drug Total Sample (Ordered Smallest to Largest) Ranks Old Drug New Drug Old Drug New Drug A) We fail to reject H0, which…arrow_forward
arrow_back_ios
SEE MORE QUESTIONS
arrow_forward_ios
Recommended textbooks for you
 MATLAB: An Introduction with ApplicationsStatisticsISBN:9781119256830Author:Amos GilatPublisher:John Wiley & Sons Inc
 Probability and Statistics for Engineering and th...StatisticsISBN:9781305251809Author:Jay L. DevorePublisher:Cengage Learning
 Statistics for The Behavioral Sciences (MindTap C...StatisticsISBN:9781305504912Author:Frederick J Gravetter, Larry B. WallnauPublisher:Cengage Learning
 Elementary Statistics: Picturing the World (7th E...StatisticsISBN:9780134683416Author:Ron Larson, Betsy FarberPublisher:PEARSON
 The Basic Practice of StatisticsStatisticsISBN:9781319042578Author:David S. Moore, William I. Notz, Michael A. FlignerPublisher:W. H. Freeman
 Introduction to the Practice of StatisticsStatisticsISBN:9781319013387Author:David S. Moore, George P. McCabe, Bruce A. CraigPublisher:W. H. Freeman
MATLAB: An Introduction with Applications
Statistics
ISBN:9781119256830
Author:Amos Gilat
Publisher:John Wiley & Sons Inc
Probability and Statistics for Engineering and th...
Statistics
ISBN:9781305251809
Author:Jay L. Devore
Publisher:Cengage Learning
Statistics for The Behavioral Sciences (MindTap C...
Statistics
ISBN:9781305504912
Author:Frederick J Gravetter, Larry B. Wallnau
Publisher:Cengage Learning
Elementary Statistics: Picturing the World (7th E...
Statistics
ISBN:9780134683416
Author:Ron Larson, Betsy Farber
Publisher:PEARSON
The Basic Practice of Statistics
Statistics
ISBN:9781319042578
Author:David S. Moore, William I. Notz, Michael A. Fligner
Publisher:W. H. Freeman
Introduction to the Practice of Statistics
Statistics
ISBN:9781319013387
Author:David S. Moore, George P. McCabe, Bruce A. Craig
Publisher:W. H. Freeman
Correlation Vs Regression: Difference Between them with definition & Comparison Chart; Author: Key Differences;https://www.youtube.com/watch?v=Ou2QGSJVd0U;License: Standard YouTube License, CC-BY
Correlation and Regression: Concepts with Illustrative examples; Author: LEARN & APPLY : Lean and Six Sigma;https://www.youtube.com/watch?v=xTpHD5WLuoA;License: Standard YouTube License, CC-BY