
Videos
a)1
Determine the total materials cost variance, price and usage variance, the cause of variance and responsible management position.
a)1
Explanation of Solution
Compute the total variance:
Hence, the total variances are $336,200 which is an unfavorable variance.
Compute the total materials price variance:
Hence, the total materials price variances are $172,200 which is an unfavorable variance.
Compute the total materials usage variance:
Hence, the total materials usage variances are $164,000 which is unfavorable variance.
K Company paid more than the budgeted for planks of wood.
The purchasing agent is responsible for the price variance. The variances are occurred because of factors like lumber shortage, and inflation.
K Company used more materials than planned which leads to unfavorable usage variance.
The production supervisor is the responsible party. The variances are occurred because of factors like lack of physically control over inventory and lack of motivation to workers.
2)
Determine the labor cost, price, and usage variance and the cause of variance and responsible management position.
2)
Explanation of Solution
Compute the total labor cost variance:
Hence, the labor variance is $49,200 which is an unfavorable variance.
Compute the labor price variance:
Hence, the labor price variance is $118,900 which is an unfavorable variance.
Compute the labor usage variance:
Hence, the labor usage variance is $69,700 which is a favorable variance.
K Company paid more than the budgeted.
The personnel manager and production supervisors are responsible for the variance. The variances are occurred because of factors like the minimum wages could have been raised by the government.
K Company used less labor than planned which leads to favorable usage variance.
The production supervisor or personal managers are the responsible party. These people motivate the employees and hired more competent people.
3)
Determine the fixed cost spending and variance and the cause of variance and refer whether the actual fixed cost per unit is lower or higher than the budgeted fixed cost per unit.
3)
Explanation of Solution
Compute the fixed cost spending variance:
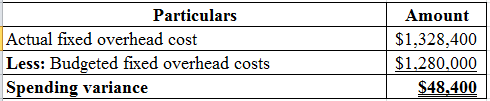
Table (1)
Hence, the spending variance is $48,400 which is unfavorable variance.
Compute the fixed cost volume variance:
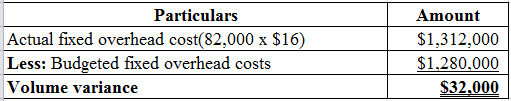
Table (2)
Hence, the volume variance is $32,000 which is favorable variance.
Working note:
Calculate the the predetermined overhead rate:
Hence, the predetermined overhead rate is $16 per table.
The Company K has paid more than the planned with respect to fixed cost. The plant manager is responsible for the rent on manufacturing equipment. The personnel manager is responsible for the salaries paid to the company supervisor.
More units were produced and sold which leads to favorable volume variance. This reduces the fixed cost per unit.
b)
Indicate that the total of material, labor, and overheads variance are equal to the total flexible
b)
Explanation of Solution
Note:
Refer the above part for the calculated values.
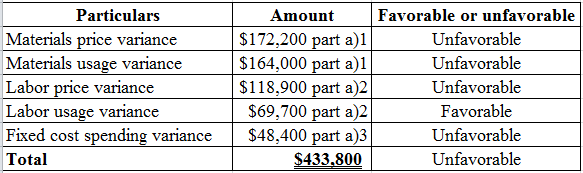
Table (3)
c)
Discuss the reaction of Person D reacts to the variance information
c)
Explanation of Solution
Discuss the reaction of Person D reacts to the variance information:
Person D should make an impartible and fair investigation on the responsible parties and causes.
Monitoring the performance is sufficient for the improvement and in the circumstances of intentional disregard and consistent incompetence the disciplinary actions can be taken.
Want to see more full solutions like this?
Chapter 15 Solutions
SURVEY OF ACCOUNTING 360DAY CONNECT CAR


- (Appendix) Overhead variances—four variance Mobile Manufacturing Inc. manufactures a small electric motor that is a replacement part for the more popular gas furnaces. The standard cost card shows the product requirements as follows: Factory overhead rates are based on normal 100% capacity and the following flexible budgets: The company produced 3,500 units, using 18,375 direct labor hours and incurring the following overhead costs: Required: Calculate the factory overhead: variable-spending, variable-efficiency, fixed-spending, and production-volume variances. Does the net variance represent under- or overapplied factory overhead?arrow_forwardRefer to the data in Exercise 9.15. Required: 1. Compute overhead variances using a two-variance analysis. 2. Compute overhead variances using a three-variance analysis. 3. Illustrate how the two- and three-variance analyses are related to the four-variance analysis. Oerstman, Inc., uses a standard costing system and develops its overhead rates from the current annual budget. The budget is based on an expected annual output of 120,000 units requiring 480,000 direct labor hours. (Practical capacity is 500,000 hours.) Annual budgeted overhead costs total 787,200, of which 556,800 is fixed overhead. A total of 119,400 units using 478,000 direct labor hours were produced during the year. Actual variable overhead costs for the year were 230,600, and actual fixed overhead costs were 556,250. Required: 1. Compute the fixed overhead spending and volume variances. How would you interpret the spending variance? Discuss the possible interpretations of the volume variance. Which is most appropriate for this example? 2. Compute the variable overhead spending and efficiency variances. How is the variable overhead spending variance like the price variances of direct labor and direct materials? How is it different? How is the variable overhead efficiency variance related to the direct labor efficiency variance?arrow_forwardCalculating factory overhead: two variances Monrovia Manufacturing Inc. normally produces 10,000 units of product A each month. Each unit requires 4 hours of direct labor, and factory overhead is applied on a direct labor hour basis. Fixed costs and variable costs in factory overhead at the normal capacity are 10 and 5 per unit, respectively. Cost and production data for June follow: a. Calculate the flexible-budget variance. b. Calculate the production-volume variance. c. Was the total factory overhead under- or overapplied? By what amount?arrow_forward
- Variance interpretation Vanadium Audio Inc. is a small manufacturer of electronic musical instruments. The plant manager received the following variable factory overhead report for the period: Actual Budgeted Variable Factory Overhead at Actual Production Controllable Variance Supplies 42,000 39,780 S 2,220 U Power and light 52,500 50,900 1,600 U Indirect factory wages 39,100 30,600 8,500 U Total 133,600 121,280 12,320 U Actual units produced: 15.000 (90% of practical capacity) The plant manager is not pleased with the 12,320 unfavorable variable factory overhead controllable variance and has come to discuss the matter with the controller. The following discussion occurred: Plant Manager: I just received this factory report for the latest month of operation. Im not very pleased with these figures. Before these numbers go to headquarters, you and I need to reach an understanding. Controller: Go ahead. Whats the problem? Plant Manager: What's the problem? Well, everything. Look at the variance. Its too large. If I understand the accounting approach being used here, you are assuming that my costs are variable to the units produced. Thus, as the production volume declines, so should these costs. Well. I dont believe these costs are variable at all. I think they are fixed costs. As a result when we operate below capacity, the costs really dont go down. Im being penalized for costs I have no control over. I need this report to be redone to reflect this fact. If anything, the difference between actual and budget is essentially a volume variance. Listen. I know that youre a team player. You really need to reconsider your assumptions on this one. If you were in the controllers position, how would you respond to the plant manager?arrow_forwardVariance interpretation You have been asked to investigate some cost problems in the Assembly Department of Ruthenium Electronics Co., a consumer electronics company. To begin your investigation, you have obtained the following budget performance report for the department for the last quarter. Ruthenium Electronics Co.Assembly Department Quarterly Budget Performance Report Standard Quantity at Standard Rates Actual Quantity at Standard Rates Quantity Variances Direct labor 157,500 227,500 70,000 U Direct materials 297,500 385,000 87,500 U Total 455,000 612,500 157,500 U You also obtained the following reports: Ruthenium Electronics Co.Purchasing Department Quarterly Budget Performance Report Actual Quantity at Standard Rates Actual Quantity at Actual Rates Price Variance Direct materials 437,500 385,000 (52,500) F Ruthenium Electronics Co.Fabrication Department Quarterly Budget Performance Report Standard Quantity at Standard Rates Actual Quantity at Standard Rates Quantity Variances Direct labor 245,000 203,000 (42,000) F Direct materials 140,000 140,000 0 Total 385,000 343,000 (42,000) F You also interviewed the Assembly Department supervisor. Excerpts from the interview follow: Q: What explains the poor performance in your department? A: Listen, youve got to understand what its been like in this department recently. Lately, it seems no matter how hard we try, we cant seem to make the standards. Im not sure what is going on, but weve been having a lot of problems lately. Q: What kind of problems? A: Well, for instance, all this Quarter weve been requisitioning purchased parts from the material storeroom, and the parts just didnt fit together very well. Im not sure what is going on, but during most of this quarter, weve had to scrap and sort purchased partsjust to get our assemblies put together. Naturally, all this takes time and material. And thats not all. Q: Go on. A: All this Quarter the work we've been receiving from the Fabrication Department has been shoddy. I mean, maybe around 20% of the stuff that comes in from Fabrication just cant be assembled. The fabrication is all wrong. As a result we've had to scrap and rework a lot of the stuff. Naturally, this has just shot our quantity variances. Interpret the variance reports in light of the comments by the Assembly Department supervisor.arrow_forwardDirect labor time variance Maywood City Police uses variance analysis to monitor police staffing. The following table identifies three common police activities, the standard time to perform each activity, and their actual frequency to establish the expected cost to serve these activities. Police Activity Standard Hours per Activity Actual Activities for Year Total Employee Hours Theft 0.60 7,000 4,200 Arrest 1.50 18,000 27,000 Patrol activities 0.30 9,000 2,700 33,900 The police are paid 25 per hour. The actual amount of hours per activity for the year were as follows: Police Activity Actual Hours per Activity Theft 0.75 Arrest 2.00 Patrol activities 0.40 A. Determine the total budgeted cost to perform the three police activities. B. Determine the total actual cost to perform the three police activities. C. Determine the direct labor time variance. D. What does the time variance suggest?arrow_forward
 Principles of Cost AccountingAccountingISBN:9781305087408Author:Edward J. Vanderbeck, Maria R. MitchellPublisher:Cengage Learning
 Cornerstones of Cost Management (Cornerstones Ser...AccountingISBN:9781305970663Author:Don R. Hansen, Maryanne M. MowenPublisher:Cengage Learning
 Survey of Accounting (Accounting I)AccountingISBN:9781305961883Author:Carl WarrenPublisher:Cengage Learning
 AccountingAccountingISBN:9781337272094Author:WARREN, Carl S., Reeve, James M., Duchac, Jonathan E.Publisher:Cengage Learning,
 Financial & Managerial AccountingAccountingISBN:9781337119207Author:Carl Warren, James M. Reeve, Jonathan DuchacPublisher:Cengage Learning