
Videos
ATC 9-1 Business Applications Case Analyzing segments at Coca-Cola
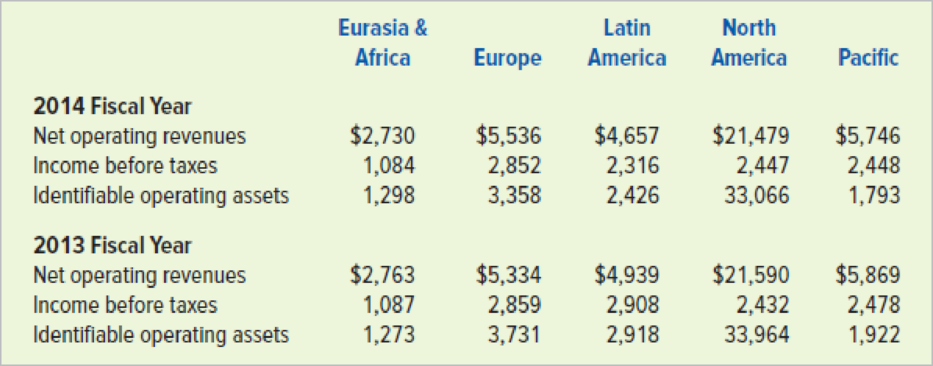
The following excerpt is from Coca-Cola Company’s 2014 annual report filed with the SEC:
Management evaluates the performance of our operating segments separately to individually monitor the different factors affecting financial performance. Our Company manages income taxes and certain treasury-related items, such as interest income and expense, on a global basis within the Corporate operating segment. We evaluate segment performance based on income or loss before income taxes.
Below are selected segment data for Coca-Cola Company for the 2014 and 2013 fiscal years. Dollar amounts are in millions.
Required
- a. Compute the ROI for each of Coke’s geographical segments for each fiscal year. Which segment appears to have the best performance during 2014 based their ROIs? Which segment showed the most improvement from 2013 to 2014?
- b. Assuming Coke’s management expects a minimum return of 30 percent, calculate the residual income for each segment for each fiscal year. Which segment appears to have the best performance based on residual income? Which segment showed the most improvement from 2013 to 2014?
- c. Explain why the segment with the highest ROI in 2013 was not the segment with the highest residual income.
- d. Assume the management of Coke is considering a major expansion effort for the next five years. On which geographic segment would you recommend Coke focus its expansion efforts? Explain the rationale for your answer.
a.
Ascertain the return on investment (ROI) for each of the geographical segments of Company CC for the years 2014 and 2013, indicate the segment that has performed well in 2014, based on the ROI, and indicate the segment that has improved from 2013 to 2014.
Explanation of Solution
Return on investment (ROI): This financial ratio evaluates how efficiently the assets are used in earning income from operations. So, ROI is a tool used to measure and compare the performance of a units or divisions of companies.
Formula of ROI:
Ascertain the ROI of Segment EA for the years 2013 and 2014.
| Particulars | 2013 | 2014 |
| Income before taxes | $1,087,000,000 | $1,084,000,000 |
| Identifiable operating assets | ÷ 1,273,000,000 | ÷ 1,298,000,000 |
| ROI | 85.4% | 83.5% |
Table (1)
Ascertain the ROI of Segment E for the years 2013 and 2014.
| Particulars | 2013 | 2014 |
| Income before taxes | $2,859,000,000 | $2,852,000,000 |
| Identifiable operating assets | ÷ 3,713,000,000 | ÷ 3,358,000,000 |
| ROI | 77.0% | 84.9% |
Table (2)
Ascertain the ROI of Segment LA for the years 2013 and 2014.
| Particulars | 2013 | 2014 |
| Income before taxes | $2,908,000,000 | $2,316,000,000 |
| Identifiable operating assets | ÷ 2,918,000,000 | ÷ 2,426,000,000 |
| ROI | 99.7% | 95.5% |
Table (3)
Ascertain the ROI of Segment NA for the years 2013 and 2014.
| Particulars | 2013 | 2014 |
| Income before taxes | $2,432,000,000 | $2,447,000,000 |
| Identifiable operating assets | ÷ 33,964,000,000 | ÷ 33,066,000,000 |
| ROI | 7.2% | 7.4% |
Table (4)
Ascertain the ROI of Segment P for the years 2013 and 2014.
| Particulars | 2013 | 2014 |
| Income before taxes | $2,478,000,000 | $2,448,000,000 |
| Identifiable operating assets | ÷ 1,922,000,000 | ÷ 1,793,000,000 |
| ROI | 128.9% | 136.5% |
Table (5)
Analysis: Of all segments, Segment P has performed well in 2014, with the highest ROI of 136.5%. Segments E, NA, and P have improved from 2013 to 2014.
b.
Ascertain the residual income for each of the geographical segments of Company CC for the years 2014 and 2013, indicate the segment that has performed well in 2014, based on the ROI, and indicate the segment that has improved from 2013 to 2014.
Explanation of Solution
Residual income: The excess of income from operations over the desired acceptable income is referred to as residual income.
Formula of residual income:
Ascertain the residual income for each of the geographical segments of Company CC for the years 2013 (amount in millions).
| Segment | Income Before Taxes | ˗ | = | Residual Income | |
| EA | $1,087 | ˗ | = | $705 | |
| E | 2,859 | ˗ | = | 1,745 | |
| LA | 2,908 | ˗ | = | 2,033 | |
| NA | 2,432 | ˗ | = | (7,757) | |
| P | 2,478 | ˗ | = | 1,901 |
Table (6)
Ascertain the residual income for each of the geographical segments of Company CC for the years 2014 (amount in millions).
| Segment | Income Before Taxes | ˗ | = | Residual Income | |
| EA | $1,084 | ˗ | = | $695 | |
| E | 2,852 | ˗ | = | 1,845 | |
| LA | 2,316 | ˗ | = | 1,588 | |
| NA | 2,447 | ˗ | = | (7,743) | |
| P | 2,448 | ˗ | = | 1,910 |
Table (7)
Analysis: Of all segments, Segment P has performed well in 2014, with the highest residual income of $1,910 million, and Segment LA performed well in 2013, with highest residual income of $2,033 million. Segments E, NA, and P have improved from 2013 to 2014, but Segment E has improved the most.
c.
Explain the reason for the segment with highest ROI in 2013, was not the segment with highest residual income.
Explanation of Solution
Reason: Residual income depends on the operating assets value. Since Segment P had more operating assets, the residual income was lower in 2013, despite highest ROI.
d.
Indicate the segment that stands as the best investment opportunity for Company CC, and give reasons.
Explanation of Solution
Best investment opportunity: Segment P would be the best segment for the investment opportunity for Company CC, based on the ROI. Company CC should consider the non-quantitative factors too before investing in Segment P.
Want to see more full solutions like this?
Chapter 15 Solutions
SURVEY OF ACCOUNTING 360DAY CONNECT CAR


- Balanced scorecard American Express Company (AXP) is a major financial services company, noted for its American Express card. Below are some of the performance measures used by the company in its balanced scorecard. For each measure, identify whether the measure best fits the innovation, customer, internal process, or financial dimension of the balanced scorecard.arrow_forwardCommunication The senior management of Tungston Company has proposed the following three performance measures for the company: 1.Net income as a percent of stockholder equity 2.Revenue growth 3.Employee satisfaction Management believes that these three measures combine both financial and nonfinancial measures and are thus superior to using just financial measures. Write a brief memo to David Tungston, the company president, providing suggestions on how to improve the companys performance measurement system.arrow_forwardEthics in Action Lucas Hunter, president of Simmons Industries Inc., believes that reporting operating cash flow per share on the income statement would be a useful addition to the companys just completed financial statements. The following discussion took place between Lucas Hunter and Simmons' controller, John Jameson, in January, after the close of the fiscal year: Lucas: Ive been reviewing our financial statements for the last year. I am disappointed that our net income per share has dropped by 10% from last year. This won't look good to our shareholders. Is there anything we can do about this? John. What do you means? The past is the past, and the numbers are in. There isnt much that can be done about it Our financial statements were prepared according to generally accepted accounting principles, and I dont see much leeway for significant change at this point. Lucan No, no. Ive not suggesting that we cook the books. But look at the cash flow from operating activities on the statement of cash flows. The cash flow from operating activities has increased by 20%. This is very good newsand. I might add, useful information. The higher cash flow from operating activities will give our creditors comfort. John. Well, the cash flow from operating activities is on the statement of cash flows, so I guess users will be able to see the improved cash flow figures there Lucas: This is true, but somehow I think this information should be given a much higher profile. I don't like this information being buried in the statement of cash flows. You know as well as I do that many users will focus on the income statement Therefore. I think we ought to include an operating cash flow per share number on the face of the income statementsomeplace under the earnings per share number In this way, users will get the complete picture of our operating performance. Yes, our earnings per share dropped this year, but our cash flow from operating activities improved! And all the information is in one place where users can see and compare the figures. What do you think? John I've never really thought about it like that before I guess we could put the operating cash flow per share on the income statement, underneath the earnings per share amount. Users would really benefit from this disclosure. Thanks for the ideaI'll start working on it. Lucas: Glad to be of service. How would you interpret this situation? Is John behaving in an ethical and professional manner?arrow_forward
- Return on assets ExxonMobil Corporation (XOM) explores, produces, and distributes oil and natural gas. The Coca-Cola Company (KO) produces and distributes soft drink beverages, including Coke. Wal-Mart Stores, Inc.., (WMT) operates retail stores and supermarkets. Analyze and explain the rankings in (2).arrow_forwardIntegrated Case NEW WORLD CHEMICALS INC. 16-16 FINANCIAL FORECASTING Sue Wilson, the new financial manager of New World Chemicals (NWC), a California producer of specialized chemicals for use in fruit orchards, must prepare a formal financial forecast for 2015. NWCs 2014 sales were 2 billon, and the marketing department is forecasting a 25% increase for 2015. Wilson thinks the company was operating at full capacity in 2014, but she is not sure. The first step in her forecast was to assume that key ratios would remain unchanged and that it would be business as usual at NWC The 2014 financial statements, the 2015 initial forecast, and a ratio analysis for 2014 and the 2015 initial forecast are given in Table 1C 16.1. Assume that you were recently hired as Wilsons assistant and that your first major task is to help her develop the formal financial forecast. She asks you to begin by answering the following questions. a. Assume (1) that NWC was operating at full capacity in 2014 with respect to all assets. (2) that all assets must grow at the same rate as sales. (3) that accounts payable and accrued liabilities also will grow at the same rate as sales, and (4) that the 2014 profit margin and dividend payout will be maintained. Under those conditions, what would the AFN equation predict the company's financial requirements to be for the coming year? b. Consultations with several key managers within NWC, including production, inventory, and receivable managers, have yielded some very useful information. 1. NWCs high DSO is largely due to one significant customer who battled through some hardships the past 2 years but who appears to be financially healthy again and is generating strong cash flow. As a result, NWCs accounts receivable manager expects the firm to lower receivables enough for a calculated DSO of 34 days without adversely affecting sales. 2. NWC was operating slightly below capacity; but its forecasted growth will require a new facility, which is expected to increase NWC's net fixed assets to 700 million. 3. A relatively new inventory management system (installed last year) has taken some time to catch on and to operate efficiently. NWC's inventory turnover improved slightly last year, but this year NWC expects even more improvement as inventories decrease and inventory turnover is expected to rise to 10 . Incorporate that information into the 2015 initial forecast results, as these adjustments to the initial forecast represent the final forecast for 2015. (Hint: Total assets do not change from the initial forecast.) c. Calculate NWCs forecasted ratios based on its final forecast and compare them with the companys 2014 historical ratios, the 2015 initial forecast ratios, and the industry averages. How does NWC compare with the average firm in its industry, and is the companys financial position expected to improve during the coming year? Explain. d. Based on the final forecast, calculate NWCs free cash flow for 2015. How does this FCF differ from the POP forecasted by NWC's initial business as usual forecast? e. Initially, some NWL managers questioned whether the new iacility expansion was necessary, especially as it results in increasing net fixed assets from 500 million to 700 million (a 40% increase). However, after extensive discussions about NWC needing to position itself for future growth and being flexible and competitive in todays marketplace, NWCs top managers agreed that the expansion was necessary. Among the issues raised by opponents was that NWCs fixed assets were being operated at only 85% of capacity. Assuming that its fixed assets were operating at only 85% of capacity, by how much could sales have increased, both in dollar terms and in percentage terms, before NWC reached full capacity? f. How would changes in the following items affect the AFN: (1) the dividend payout ratio, (2) the profit margin, (3) the capital intensity ratio, and (4) NWC beginning to buy from its suppliers on terms that permit it to pay after 60 days rather than after 30 days? (Consider each item separately and hold all other things constant) Financial Statements and Other Data on NWC (Millions of Dollars) Table 1C 16.1 A. Balance Sheets 2014 2015E Cash and equivalents 20 25 Accounts receivable 240 300 Inventories 240 300 Total current assets S 500 625 Net fixed assets 500 625 Total assets 1,000 1,250 Accounts payable and accrued liabilities 100 125 Notes payable 100 190 Total current liabilities 200 315 Long-term debt 100 190 Common stock 500 500 Retained earnings 200 245 Total liabilities and equity 1,000 1,250 B. Income Statements 2014 2015E Sales 2,000.00 2,500.00 Variable costs 1,200.00 1,500.00 Fixed costs 700.00 875.00 Earnings before interest and taxes (EBIT) 100.00 125.00 Interest 16.00 16.00 Earnings before taxes (EBT) 84.00 109.00 Taxes (40%) 33.60 43.60 Net income 50.40 65.40 Dividends (30%) 15.12 19.62 Addition to retained earnings 35.28 45.78 C. Key Ratios NWC (2014) NWC (2015E) Industry Comment Basic earning power 10.00% 10.00% 20.00% Profit margin 232 2.62 4.00 Return on equity 7.20 8.77 15.60 Days sales outstanding (365 days) 43.80 days 43.80 days 32.00 days Inventory turnover 8.33 8.33 11.00 Fixed assets turnover 4.00 4.00 5.00 Total assets turnover 2.00 2.00 2.50 Total 1iabi1ities/Assets 30.00% 40.40% 36.00% Times interest earned 6.25 7.81 9.40 Current ratio 2.50 1.99 3.00 Payout ratio 30.00% 30.00% 30.00%arrow_forwardEffect of Industry Characteristics on Financial Statement Relations: A Global Perspective. Effective financial statement analysis requires an understanding of a firms economic characteristics. The relations between various financial statement items provide evidence of many of these economic characteristics. Exhibit 1.24 (pages 6667) presents common-size condensed balance sheets and income statements for 12 firms in different industries. These common-size balance sheets and income statements express various items as a percentage of operating revenues. (That is, the statement divides all amounts by operating revenues for the year.) A dash for a particular financial statement item does not necessarily mean the amount is zero. It merely indicates that the amount is not sufficiently large for the firm to disclose it. A list of the 12 companies, the country of their headquarters, and a brief description of their activities follow. A. Accor (France): Worlds largest hotel group, operating hotels under the names of Sofitel, Novotel, Motel 6, and others. Accor has grown in recent years by acquiring established hotel chains. B. Carrefour (France): Operates grocery supermarkets and hypermarkets in Europe, Latin America, and Asia. C. Deutsche Telekom (Germany): Europes largest provider of wired and wireless telecommunication services. The telecommunications industry has experienced increased deregulation in recent years. D. E.ON AG (Germany): One of the major public utility companies in Europe and the worlds largest privately owned energy service provider. E. Fortis (Netherlands): Offers insurance and banking services. Operating revenues include insurance premiums received, investment income, and interest revenue on loans. Operating expenses include amounts actually paid or amounts it expects to pay in the future on insurance coverage outstanding during the year. F. Interpublic Group (U.S.): Creates advertising copy for clients. Interpublic purchases advertising time and space from various media and sells it to clients. Operating revenues represent the commissions or fees earned for creating advertising copy and selling media time and space. Operating expenses include employee compensation. G. Marks Spencer (U.K.): Operates department stores in England and other retail stores in Europe and the United States. Offers its own credit card for customers purchases. H. Nestl (Switzerland): Worlds largest food processor, offering prepared foods, coffees, milk-based products, and mineral waters. I. Roche Holding (Switzerland): Creates, manufactures, and distributes a wide variety of prescription drugs. J. Sumitomo Metal (Japan): Manufacturer and seller of steel sheets and plates and other construction materials. K. Sun Microsystems (U.S.): Designs, manufactures, and sells workstations and servers used to maintain integrated computer networks. Sun outsources the manufacture of many of its computer components. L. Toyota Motor (Japan): Manufactures automobiles and offers financing services to its customers. REQUIRED Use the ratios to match the companies in Exhibit 1.24 with the firms listed above.arrow_forward
- INTEGRATED CASE NEW WORLD CHEMICALS INC. FINANCIAL FORECASTING Sue Wilson, the new financial manager of New World Chemicals (NWC), a California producer of specialized chemicals for use in fruit orchards, must prepare a formal financial forecast for 2017. NWCs 2016 sales were 2 billion, and the marketing department is forecasting a 25% increase for 2017. Wilson thinks the company was operating at full capacity in 2016, but she is not sure. The first step in her forecast was to assume that key ratios would remain unchanged and that it would be business as usual at NWC. The 2016 financial statements, the 2017 initial forecast, and a ratio analysis for 2016 and the 2017 initial forecast are given in Table IC 16.1. Assume that you were recently hired as Wilsons assistant and that your first major task is to help her develop the formal financial forecast. She asks you to begin by answering the following questions. a. Assume (1) that NWC was operating at full capacity in 2016 with respect to all assets, (2) that all assets must grow at the same rate as sales, (3) that accounts payable and accrued liabilities also will grow at the same rate as sales, and (4) that the 2016 profit margin and dividend payout will be maintained. Under those conditions, what would the AFN equation predict the companys financial requirements to be for the coming year? b. Consultations with several key managers within NWC, including production, inventory, and receivable managers, have yielded some very useful information. 1. NWCs high DSO is largely due to one significant customer who battled through some hardships the past 2 years but who appears to be financially healthy again and is generating strong cash flow. As a result, NWCs accounts receivable manager expects the Firm to lower receivables enough for a calculated DSO of 34 days without adversely affecting sales. 2. NWC was operating slightly below capacity; but its forecasted growth will require a new facility, which is expected to increase NWCs net Fixed assets to 700 million. 3. A relatively new inventory management system (installed last year) has taken some time to catch on and to operate efficiently. NWCs inventory turnover improved slightly last year, but this year NWC expects even more improvement as inventories decrease and inventory turnover is expected to rise to 10. Incorporate that information into the 2017 initial forecast results, as these adjustments to the initial forecast represent the final forecast for 2017. (Hint: Total assets do not change from the initial forecast.) c. Calculate NWCs forecasted ratios based on its final forecast and compare them with the companys 2016 historical ratios, the 2017 initial forecast ratios, and the industry averages. How does NWC compare with the average firm in its industry, and is the companys financial position expected to improve during the coming year? Explain. d. Based on the final forecast, calculate NWCs free cash flow for 2017. How does this FCF differ from the FCF forecasted by NWCs initial business as usual forecast? e. Initially, some NWC managers questioned whether the new facility expansion was necessary, especially as it results in increasing net fixed assets from 500 million to 700 million (a 40% increase). However, after extensive discussions about NWC needing to position itself for future growth and being flexible and competitive in todays marketplace, NWCs top managers agreed that the expansion was necessary. Among the issues raised by opponents was that NWCs fixed assets were being operated at only 85% of capacity. Assuming that its fixed assets were operating at only 85% of capacity, by how much could sales have increased, both in dollar terms and in percentage terms, before NWC reached full capacity? f. How would changes in the following items affect the AFN: (1) the dividend payout ratio, (2) the profit margin, (3) the capital intensity ratio, and (4) NWC beginning to buy from its suppliers on terms that permit it to pay after 60 days rather than after 30 days? (Consider each item separately and hold all other things constant.) TABLE IC 16.1 Financial Statements and Other Data on NWC (Millions of Dollars) A. Balance Sheets 2016 2017E Cash and equivalents 20 25 Accounts receivable 240 300 Inventories 240 300 Total current assets 500 625 Net fixed assets 500 625 Total assets 1,000 1,250 Accounts payable and accrued liabilities 100 125 Notes payable 100 190 Total current liabilities 200 315 Long-term debt 100 190 Common stock 500 500 Retained earnings 200 245 Total liabilities and equity 1,000 1.250 B. Income Statements 2016 2017E Sales 2,000.00 2,500.00 Variable costs 1,200.00 1,500.00 Fixed costs 700.00 875.00 Earnings before interest and taxes (EBIT) 100.00 125.00 Interest 16.00 16.00 Earnings before taxes (EBT) 84.00 109.00 Taxes (40%) 33.60 43.60 Net income 50.40 65.40 Dividends (30%) 15.12 19.62 Addition to retained earnings 35.28 45.78arrow_forwardBalanced scorecard Delta Air Lines, Inc. (DAL) provides passenger services throughout the United States and the world. Fifteen Delta metrics and recent initiatives are as follows 1. Using a mobile phone app that allows passengers to monitor their place in standby and first class upgrade lists 2. Improving the efficiency of aircraft maintenance 3. Increasing the number of check-in kiosks at major airports 4. Replacing less fuel-efficient aircraft with newer, more efficient aircraft 5. Reducing turnover of key employees 6. Reducing the number of cancelled flights 7. Investing in oil refinery thai produces jet fuel 8. Offering cash incentive awards to employees 9. Awarding stock options to key employees that can be used over time 10. Increasing passenger revenue per available seat mile 11. Increasing the percentage of on-time arrivals 12. Reducing the number of passenger complaints 13- Reducing the number of lost passenger bags 14. Reducing the number of safety violations 15. Increasing the passenger load percentage Assign each item to one of the four dimensions of the balanced scorecard 1.learning and innovation 2.customer 3.internal process 4.financialarrow_forwardEffect of Industry Characteristics on Financial Statement Relations. Effective financial statement analysis requires an understanding of a firms economic characteristics. The relations between various financial statement items provide evidence of many of these economic characteristics. Exhibit 1.22 (pages 6061) presents common-size condensed balance sheets and income statements for 12 firms in different industries. These common-size balance sheets and income statements express various items as a percentage of operating revenues. (That is, the statement divides all amounts by operating revenues for the year.) Exhibit 1.22 also shows the ratio of cash flow from operations to capital expenditures. A dash for a particular financial statement item does not necessarily mean the amount is zero. It merely indicates that the amount is not sufficiently large enough for the firm to disclose it. Amounts that are not meaningful are shown as n.m. A list of the 12 companies and a brief description of their activities follow. A. Amazon.com: Operates websites to sell a wide variety of products online. The firm operated at a net loss in all years prior to that reported in Exhibit 1.22. B. Carnival Corporation: Owns and operates cruise ships. C. Cisco Systems: Manufactures and sells computer networking and communications products. D. Citigroup: Offers a wide range of financial services in the commercial banking, insurance, and securities business. Operating expenses represent the compensation of employees. E. eBay: Operates an online trading platform for buyers to purchase and sellers to sell a variety of goods. The firm has grown in part by acquiring other companies to enhance or support its online trading platform. F. Goldman Sachs: Offers brokerage and investment banking services. Operating expenses represent the compensation of employees. G. Johnson Johnson: Develops, manufactures, and sells pharmaceutical products, medical equipment, and branded over-the-counter consumer personal care products. H. Kelloggs: Manufactures and distributes cereal and other food products. The firm acquired other branded food companies in recent years. I. MGM Mirage: Owns and operates hotels, casinos, and golf courses. J. Molson Coors: Manufactures and distributes beer. Molson Coors has made minority ownership investments in other beer manufacturers in recent years. K. Verizon: Maintains a telecommunications network and offers telecommunications services. Operating expenses represent the compensation of employees. Verizon has made minority investments in other cellular and wireless providers. L. Yum! Brands: Operates chains of name-brand restaurants, including Taco Bell, KFC, and Pizza Hut. REQUIRED Use the ratios to match the companies in Exhibit 1.22 with the firms listed above.arrow_forward
 Financial & Managerial AccountingAccountingISBN:9781337119207Author:Carl Warren, James M. Reeve, Jonathan DuchacPublisher:Cengage Learning
 Financial & Managerial AccountingAccountingISBN:9781285866307Author:Carl Warren, James M. Reeve, Jonathan DuchacPublisher:Cengage Learning
 Accounting (Text Only)AccountingISBN:9781285743615Author:Carl Warren, James M. Reeve, Jonathan DuchacPublisher:Cengage Learning
 AccountingAccountingISBN:9781337272094Author:WARREN, Carl S., Reeve, James M., Duchac, Jonathan E.Publisher:Cengage Learning,
 Survey of Accounting (Accounting I)AccountingISBN:9781305961883Author:Carl WarrenPublisher:Cengage Learning
 Financial Reporting, Financial Statement Analysis...FinanceISBN:9781285190907Author:James M. Wahlen, Stephen P. Baginski, Mark BradshawPublisher:Cengage Learning