
Videos
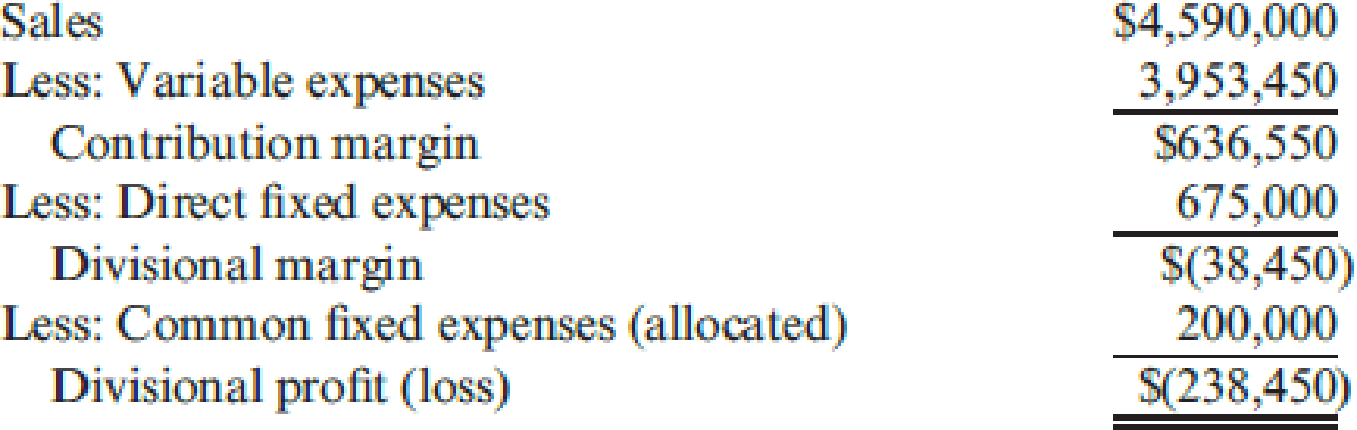
Dantrell Palmer has just been appointed manager of Kirchner Glass Products Division. He has two years to make the division profitable. If the division is still showing a loss after two years, it will be eliminated, and Dantrell will be reassigned as an assistant divisional manager in another division. The divisional income statement for the most recent year is as follows:
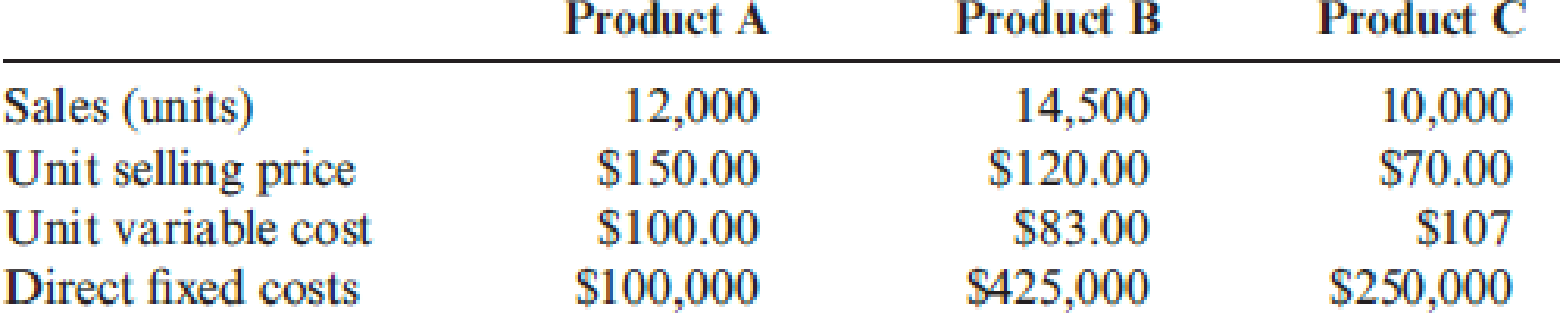
Upon arriving at the division, Dantrell requested the following data on the division’s three products:
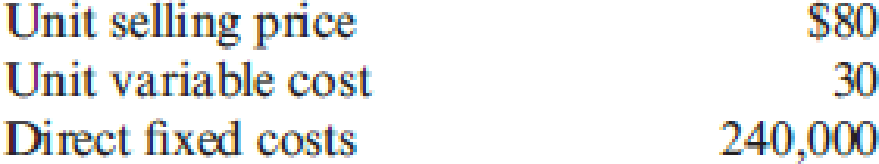
He also gathered data on a proposed new product (Product D). If this product is added, it would displace one of the current products; the quantity that could be produced and sold would equal the quantity sold of the product it displaces, although demand limits the maximum quantity that could be sold to 20,000 units. Because of specialized production equipment, it is not possible for the new product to displace part of the production of a second product. The information on Product D is as follows:
Required:
- 1. Prepare segmented income statements for Products A, B, and C.
- 2. Determine the products that Dantrell should produce for the coming year. Prepare segmented income statements that prove your combination is the best for the division. By how much will profits improve given the combination that you selected? (Hint: Your combination may include one, two, or three products.)
Want to see the full answer?
Check out a sample textbook solution
Chapter 18 Solutions
Cornerstones of Cost Management (Cornerstones Series)


- Bill Fremont, division controller and CMA, was upset by a recent memo he received from the divisional manager, Steve Preston. Bill was scheduled to present the divisions financial performance at headquarters in one week. In the memo, Steve had given Bill some instructions for this upcoming report. In particular, Bill had been told to emphasize the significant improvement in the divisions profits over last year. Bill, however, didnt believe that there was any real underlying improvement in the divisions performance and was reluctant to say otherwise. He knew that the increase in profits was because of Steves conscious decision to produce more inventory. In an earlier meeting, Steve had convinced his plant managers to produce more than they knew they could sell. He argued that by deferring some of this periods fixed costs, reported profits would jump. He pointed out two significant benefits. First, by increasing profits, the division could exceed the minimum level needed so that all the managers would qualify for the annual bonus. Second, by meeting the budgeted profit level, the division would be better able to compete for much-needed capital. Bill objected but had been overruled. The most persuasive counterargument was that the increase in inventory could be liquidated in the coming year as the economy improved. Bill, however, considered this event unlikely. From past experience, he knew that it would take at least two years of improved market demand before the productive capacity of the division was exceeded. Required: 1. Discuss the behavior of Steve Preston, the divisional manager. Was the decision to produce for inventory an ethical one? 2. What should Bill Fremont do? Should he comply with the directive to emphasize the increase in profits? If not, what options does he have? 3. Chapter 1 listed ethical standards for management accountants. Identify any standards that apply in this situation.arrow_forwardKent Tessman, manager of a Dairy Products Division, was pleased with his divisions performance over the past three years. Each year, divisional profits had increased, and he had earned a sizable bonus. (Bonuses are a linear function of the divisions reported income.) He had also received considerable attention from higher management. A vice president had told him in confidence that if his performance over the next three years matched his first three, he would be promoted to higher management. Determined to fulfill these expectations, Kent made sure that he personally reviewed every capital budget request. He wanted to be certain that any funds invested would provide good, solid returns. (The divisions cost of capital is 10 percent.) At the moment, he is reviewing two independent requests. Proposal A involves automating a manufacturing operation that is currently labor intensive. Proposal B centers on developing and marketing a new ice cream product. Proposal A requires an initial outlay of 250,000, and Proposal B requires 312,500. Both projects could be funded, given the status of the divisions capital budget. Both have an expected life of six years and have the following projected after-tax cash flows: After careful consideration of each investment, Kent approved funding of Proposal A and rejected Proposal B. Required: 1. Compute the NPV for each proposal. 2. Compute the payback period for each proposal. 3. According to your analysis, which proposal(s) should be accepted? Explain. 4. Explain why Kent accepted only Proposal A. Considering the possible reasons for rejection, would you judge his behavior to be ethical? Explain.arrow_forwardForchen, Inc., provided the following information for two of its divisions for last year: Required: 1. For the Small Appliances Division, calculate: a. Average operating assets b. Margin c. Turnover d. Return on investment (ROI) 2. For the Cleaning Products Division, calculate: a. Average operating assets b. Margin c. Turnover d. Return on investment (ROI) 3. What if operating income for the Small Appliances Division was 2,000,000? How would that affect average operating assets? Margin? Turnover? ROI? Calculate any changed ratios (round to four significant digits).arrow_forward
- Jarriot, Inc., presented two years of data for its Furniture Division and its Houseware Division. Required: 1. Compute the ROI and the margin and turnover ratios for each year for the Furniture Division. (Round your answers to four significant digits.) 2. Compute the ROI and the margin and turnover ratios for each year for the Houseware Division. (Round your answers to four significant digits.) 3. Explain the change in ROI from Year 1 to Year 2 for each division.arrow_forwardGrate Care Company specializes in producing products for personal grooming. The company operates six divisions, including the Hair Products Division. Each division is treated as an investment center. Managers are evaluated and rewarded on the basis of ROI performance. Only those managers who produce the best ROIs are selected to receive bonuses and to fill higher-level managerial positions. Fred Olsen, manager of the Hair Products Division, has always been one of the top performers. For the past two years, Freds division has produced the largest ROI; last year, the division earned an operating income of 2.56 million and employed average operating assets valued at 16 million. Fred is pleased with his divisions performance and has been told that if the division does well this year, he will be in line for a headquarters position. For the coming year, Freds division has been promised new capital totaling 1.5 million. Any of the capital not invested by the division will be invested to earn the companys required rate of return (9 percent). After some careful investigation, the marketing and engineering staff recommended that the division invest in equipment that could be used to produce a crimping and waving iron, a product currently not produced by the division. The cost of the equipment was estimated at 1.2 million. The divisions marketing manager estimated operating earnings from the new line to be 156,000 per year. After receiving the proposal and reviewing the potential effects, Fred turned it down. He then wrote a memo to corporate headquarters, indicating that his division would not be able to employ the capital in any new projects within the next eight to 10 months. He did note, however, that he was confident that his marketing and engineering staff would have a project ready by the end of the year. At that time, he would like to have access to the capital. Required: 1. Explain why Fred Olsen turned down the proposal to add the capability of producing a crimping and waving iron. Provide computations to support your reasoning. 2. Compute the effect that the new product line would have on the profitability of the firm as a whole. Should the division have produced the crimping and waving iron? 3. Suppose that the firm used residual income as a measure of divisional performance. Do you think Freds decision might have been different? Why? 4. Explain why a firm like Grate Care might decide to use both residual income and return on investment as measures of performance. 5. Did Fred display ethical behavior when he turned down the investment? In discussing this issue, consider why he refused to allow the investment.arrow_forwardAt the end of 20x1, Mejorar Company implemented a low-cost strategy to improve its competitive position. Its objective was to become the low-cost producer in its industry. A Balanced Scorecard was developed to guide the company toward this objective. To lower costs, Mejorar undertook a number of improvement activities such as JIT production, total quality management, and activity-based management. Now, after two years of operation, the president of Mejorar wants some assessment of the achievements. To help provide this assessment, the following information on one product has been gathered: Required: 1. Compute the following measures for 20x1 and 20x3: a. Actual velocity and cycle time b. Percentage of total revenue from new customers (assume one unit per customer) c. Percentage of very satisfied customers (assume each customer purchases one unit) d. Market share e. Percentage change in actual product cost (for 20x3 only) f. Percentage change in days of inventory (for 20x3 only) g. Defective units as a percentage of total units produced h. Total hours of training i. Suggestions per production worker j. Total revenue k. Number of new customers 2. For the measures listed in Requirement 1, list likely strategic objectives, classified according to the four Balance Scorecard perspectives. Assume there is one measure per objective.arrow_forward
- In 20x5, Major Company initiated a full-scale, quality improvement program. At the end of the year, Jack Aldredge, the president, noted with some satisfaction that the defects per unit of product had dropped significantly compared to the prior year. He was also pleased that relationships with suppliers had improved and defective materials had declined. The new quality training program was also well accepted by employees. Of most interest to the president, however, was the impact of the quality improvements on profitability. To help assess the dollar impact of the quality improvements, the actual sales and the actual quality costs for 20x4 and 20x5 are as follows by quality category: All prevention costs are fixed (by discretion). Assume all other quality costs are unit-level variable. Required: 1. Compute the relative distribution of quality costs for each year and prepare a pie chart. Do you believe that the company is moving in the right direction in terms of the balance among the quality cost categories? Explain. 2. Prepare a one-year trend performance report for 20x5 (compare the actual costs of 20x5 with those of 20x4, adjusted for differences in sales volume). How much have profits increased because of the quality improvements made by Major Company? 3. Estimate the additional improvement in profits if Major Company ultimately reduces its quality costs to 2.5 percent of sales revenues (assume sales of 10 million).arrow_forwardJane Erickson, manager of an electronics division, was not pleased with the results that had recently been reported concerning the divisions activity-based management implementation project. For one thing, the project had taken eight months longer than projected and had exceeded the budget by nearly 35 percent. But even more vexatious was the fact that after all was said and done, about three-fourths of the plants were reporting that the activity-based product costs were not much different for most of the products than those of the old costing system. Plant managers were indicating that they were continuing to use the old costs as they were easier to compute and understand. Yet, at the same time, they were complaining that they were having a hard time meeting the bids of competitors. Reliable sources were also revealing that the divisions product costs were higher than many competitors. This outcome perplexed plant managers because their control system still continued to report favorable materials and labor efficiency variances. They complained that ABM had failed to produce any significant improvement in cost performance. Jane decided to tour several of the plants and talk with the plant managers. After the tour, she realized that her managers did not understand the concept of non-value-added costs nor did they have a good grasp of the concept of kaizen costing. No efforts were being made to carefully consider the activity information that had been produced. One typical plant manager threw up his hands and said: This is too much data. Why should I care about all this detail? I do not see how this can help me improve my plants performance. They tell me that inspection is not a necessary activity and does not add value. I simply cant believe that inspecting isnt value-added and necessary. If we did not inspect, we would be making and sending more bad products to customers. Required: Explain why Janes division is having problems with its ABM implementation.arrow_forwardThe three divisions of Yummy Foods are Snack Goods, Cereal, and Frozen Foods. The divisions are structured as investment centers. The following responsibility reports were prepared for the three divisions for the prior year: a. Which division is making the best use of invested assets and should be given priority for future capital investments? b. b. Assuming that the minimum acceptable return on new projects is 19%, would all investments that produce a return in excess of 19% be accepted by the divisions? Explain. c. c. Identify opportunities for improving the companys financial performance.arrow_forward
- Javier Company has sales of 8 million and quality costs of 1,600,000. The company is embarking on a major quality improvement program. During the next three years, Javier intends to attack failure costs by increasing its appraisal and prevention costs. The right prevention activities will be selected, and appraisal costs will be reduced according to the results achieved. For the coming year, management is considering six specific activities: quality training, process control, product inspection, supplier evaluation, prototype testing, and redesign of two major products. To encourage managers to focus on reducing non-value-added quality costs and select the right activities, a bonus pool is established relating to reduction of quality costs. The bonus pool is equal to 10 percent of the total reduction in quality costs. Current quality costs and the costs of these six activities are given in the following table. Each activity is added sequentially so that its effect on the cost categories can be assessed. For example, after quality training is added, the control costs increase to 320,000, and the failure costs drop to 1,040,000. Even though the activities are presented sequentially, they are totally independent of each other. Thus, only beneficial activities need be selected. Required: 1. Identify the control activities that should be implemented, and calculate the total quality costs associated with this selection. Assume that an activity is selected only if it increases the bonus pool. 2. Given the activities selected in Requirement 1, calculate the following: a. The reduction in total quality costs b. The percentage distribution for control and failure costs c. The amount for this years bonus pool 3. Suppose that a quality engineer complained about the gainsharing incentive system. Basically, he argued that the bonus should be based only on reductions of failure and appraisal costs. In this way, investment in prevention activities would be encouraged, and eventually, failure and appraisal costs would be eliminated. After eliminating the non-value-added costs, focus could then be placed on the level of prevention costs. If this approach were adopted, what activities would be selected? Do you agree or disagree with this approach? Explain.arrow_forwardAt the beginning of the last quarter of 20x1, Youngston, Inc., a consumer products firm, hired Maria Carrillo to take over one of its divisions. The division manufactured small home appliances and was struggling to survive in a very competitive market. Maria immediately requested a projected income statement for 20x1. In response, the controller provided the following statement: After some investigation, Maria soon realized that the products being produced had a serious problem with quality. She once again requested a special study by the controllers office to supply a report on the level of quality costs. By the middle of November, Maria received the following report from the controller: Maria was surprised at the level of quality costs. They represented 30 percent of sales, which was certainly excessive. She knew that the division had to produce high-quality products to survive. The number of defective units produced needed to be reduced dramatically. Thus, Maria decided to pursue a quality-driven turnaround strategy. Revenue growth and cost reduction could both be achieved if quality could be improved. By growing revenues and decreasing costs, profitability could be increased. After meeting with the managers of production, marketing, purchasing, and human resources, Maria made the following decisions, effective immediately (end of November 20x1): a. More will be invested in employee training. Workers will be trained to detect quality problems and empowered to make improvements. Workers will be allowed a bonus of 10 percent of any cost savings produced by their suggested improvements. b. Two design engineers will be hired immediately, with expectations of hiring one or two more within a year. These engineers will be in charge of redesigning processes and products with the objective of improving quality. They will also be given the responsibility of working with selected suppliers to help improve the quality of their products and processes. Design engineers were considered a strategic necessity. c. Implement a new process: evaluation and selection of suppliers. This new process has the objective of selecting a group of suppliers that are willing and capable of providing nondefective components. d. Effective immediately, the division will begin inspecting purchased components. According to production, many of the quality problems are caused by defective components purchased from outside suppliers. Incoming inspection is viewed as a transitional activity. Once the division has developed a group of suppliers capable of delivering nondefective components, this activity will be eliminated. e. Within three years, the goal is to produce products with a defect rate less than 0.10 percent. By reducing the defect rate to this level, marketing is confident that market share will increase by at least 50 percent (as a consequence of increased customer satisfaction). Products with better quality will help establish an improved product image and reputation, allowing the division to capture new customers and increase market share. f. Accounting will be given the charge to install a quality information reporting system. Daily reports on operational quality data (e.g., percentage of defective units), weekly updates of trend graphs (posted throughout the division), and quarterly cost reports are the types of information required. g. To help direct the improvements in quality activities, kaizen costing is to be implemented. For example, for the year 20x1, a kaizen standard of 6 percent of the selling price per unit was set for rework costs, a 25 percent reduction from the current actual cost. To ensure that the quality improvements were directed and translated into concrete financial outcomes, Maria also began to implement a Balanced Scorecard for the division. By the end of 20x2, progress was being made. Sales had increased to 26,000,000, and the kaizen improvements were meeting or beating expectations. For example, rework costs had dropped to 1,500,000. At the end of 20x3, two years after the turnaround quality strategy was implemented, Maria received the following quality cost report: Maria also received an income statement for 20x3: Maria was pleased with the outcomes. Revenues had grown, and costs had been reduced by at least as much as she had projected for the two-year period. Growth next year should be even greater as she was beginning to observe a favorable effect from the higher-quality products. Also, further quality cost reductions should materialize as incoming inspections were showing much higher-quality purchased components. Required: 1. Identify the strategic objectives, classified by the Balanced Scorecard perspective. Next, suggest measures for each objective. 2. Using the results from Requirement 1, describe Marias strategy using a series of if-then statements. Next, prepare a strategy map. 3. Explain how you would evaluate the success of the quality-driven turnaround strategy. What additional information would you like to have for this evaluation? 4. Explain why Maria felt that the Balanced Scorecard would increase the likelihood that the turnaround strategy would actually produce good financial outcomes. 5. Advise Maria on how to encourage her employees to align their actions and behavior with the turnaround strategy.arrow_forwardSuppose that Kicker had the following sales and cost experience (in thousands of dollars) for May of the current year and for May of the prior year: In May of the prior year, Kicker started an intensive quality program designed to enable it to build original equipment manufacture (OEM) speaker systems for a major automobile company. The program was housed in research and development. In the beginning of the current year, Kickers accounting department exercised tighter control over sales commissions, ensuring that no dubious (e.g., double) payments were made. The increased sales in the current year required additional warehouse space that Kicker rented in town. (Round ratios to four decimal places. Round sales dollars computations to the nearest dollar.) Required: 1. Calculate the contribution margin ratio for May of both years. 2. Calculate the break-even point in sales dollars for both years. 3. Calculate the margin of safety in sales dollars for both years. 4. CONCEPTUAL CONNECTION Analyze the differences shown by your calculations in Requirements 1, 2, and 3.arrow_forward
 Cornerstones of Cost Management (Cornerstones Ser...AccountingISBN:9781305970663Author:Don R. Hansen, Maryanne M. MowenPublisher:Cengage Learning
 Financial And Managerial AccountingAccountingISBN:9781337902663Author:WARREN, Carl S.Publisher:Cengage Learning,
 Managerial AccountingAccountingISBN:9781337912020Author:Carl Warren, Ph.d. Cma William B. TaylerPublisher:South-Western College Pub
 Managerial Accounting: The Cornerstone of Busines...AccountingISBN:9781337115773Author:Maryanne M. Mowen, Don R. Hansen, Dan L. HeitgerPublisher:Cengage Learning