Fundamentals Of Cost Accounting (6th Edition)
6th Edition
ISBN: 9781259969478
Author: WILLIAM LANEN, Shannon Anderson, Michael Maher
Publisher: McGraw Hill Education
expand_more
expand_more
format_list_bulleted
Videos
Textbook Question
Chapter 18, Problem 47P
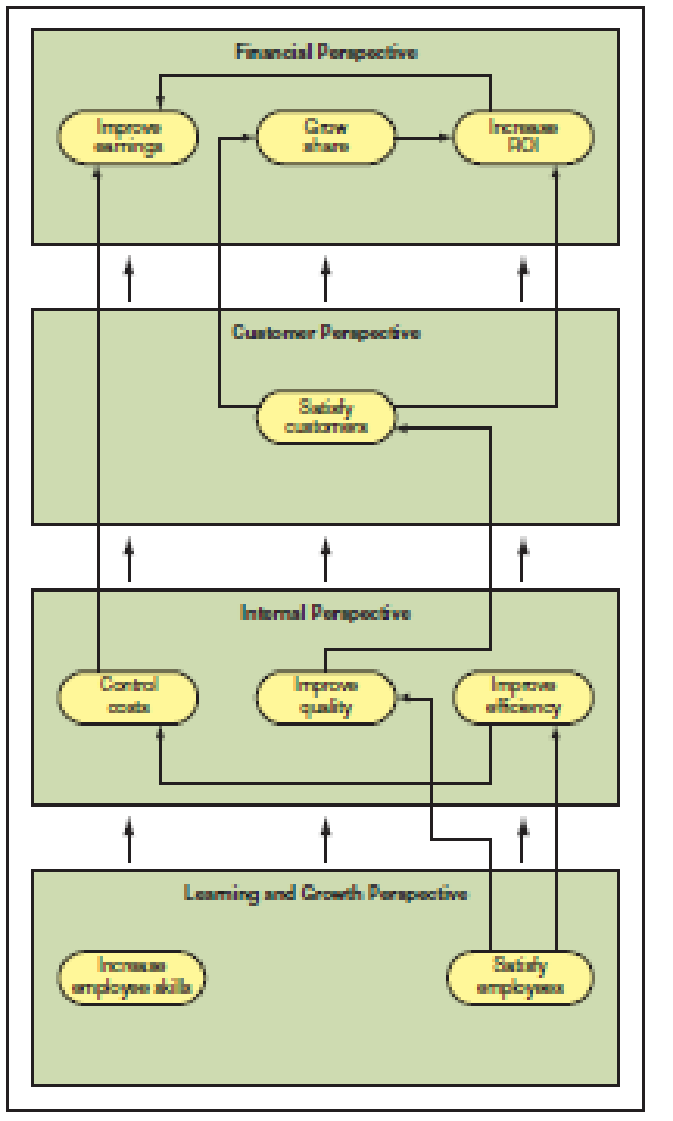
Balanced Scorecards and Strategy Maps
Hill Street Company (HSC) manufactures plastic parts for the home construction industry. The market is extremely competitive and margins are thin. The company recently adopted a balanced scorecard for performance evaluation. As part of that exercise, managers at HSC developed the following strategy map.
Required
- a. Using the strategy map, comment on the performance measures used for each of the four perspectives of the scorecard. Would you recommend any changes to the measures? If so, what changes would you make? Why?
- b. What are the strengths and weaknesses of the strategy map as developed by HSC?
- c. Recommend changes to the map that will better communicate the strategy for HSC and incorporate your recommendations from requirement (a).
Expert Solution & Answer
Want to see the full answer?
Check out a sample textbook solution
Students have asked these similar questions
Creating Balanced Scorecard? that Support Different Strategies
The Midwest Consulting Group (MCG) helps companies build balanced scorecards. As part of its marketing efforts. MCG conducts an annual balanced scorecard workshop for prospective clients. As MCG’s newest employee, your boss has asked you to participate in this year’s workshop by explaining to attendees how a company’s strategy determines the measures that are appropriate for its balanced scorecard. Your boss has provided you with the excerpts below from the annual reports of two current MCG clients. She has asked you to use these excerpts in your portion of the workshop.
Excerpt from Applied Pharmaceuticals’ annual report:
The keys to our business are consistent and timely new product introductions and manufacturing process integrity. The new product introduction side of the equation is a function of research and development (R&D) yield (e.g., the number of marketable drug compounds created relative to the total number…
Describing the balanced scorecard and identifying key performance indicators for each perspective
Consider the following key performance indicators, and classify each indicator according to the balanced scorecard perspective it addresses. Choose from the financial perspective, customer perspective, internal business perspective, and the learning and growth perspective.
a. Number of customer complaints
b. Number of information system upgrades completed
c. Residual income
d. New product development time
e. Employee turnover rate
f. Percentage of products with online help manuals
g. Customer retention
h. Percentage of compensation based on performance
i. Percentage of orders filled each week
j. Gross margin growth
k. Number of new patents
l. Employee satisfaction ratings
m. Manufacturing cycle time (average length of production process)
n. Earnings growth
o. Average machine setup time
p. Number of new customers
q. Employee promotion rate
r. Cash flow from operations
s. Customer…
Balanced scorecard. Pineway Electric manufactures electric motors. It competes and plans to grow by selling high-quality motors at a low price and by delivering them to customers in a reasonable time after receiving customers’ orders. There are many other manufacturers who produce similar motors. Pineway believes that continuously improving its manufacturing processes and having satisfied employees are critical to implementing its strategy in 2017.
Q. Draw a strategy map as in Exhibit 12-2 with at least two strategic objectives you would expect to see under each balanced scorecard perspective. Identify what you believe are any (a) strong ties, (b) focal points, (c) trigger points, and (d) distinctive objectives. Comment on the structural analysis of your strategy map.
Chapter 18 Solutions
Fundamentals Of Cost Accounting (6th Edition)
Ch. 18 - Why is it important for management accountants to...Ch. 18 - A balanced scorecard is a set of two or more...Ch. 18 - What is a business model?Ch. 18 - What are the advantages of financial measures of...Ch. 18 - Prob. 5RQCh. 18 - Why do effective performance evaluation systems...Ch. 18 - What is benchmarking?Ch. 18 - Prob. 8RQCh. 18 - Prob. 9RQCh. 18 - Prob. 10RQ
Ch. 18 - Prob. 11RQCh. 18 - Prob. 12RQCh. 18 - Prob. 13RQCh. 18 - Prob. 14RQCh. 18 - Prob. 15RQCh. 18 - Prob. 16CADQCh. 18 - Prob. 17CADQCh. 18 - Prob. 18CADQCh. 18 - Prob. 19CADQCh. 18 - Prob. 20CADQCh. 18 - Prob. 21CADQCh. 18 - Prob. 22CADQCh. 18 - Prob. 23CADQCh. 18 - Prob. 24CADQCh. 18 - Strategy and Management Accounting Systems Joes...Ch. 18 - Business Strategy Classification Consider the...Ch. 18 - Prob. 27ECh. 18 - Prob. 28ECh. 18 - Prob. 29ECh. 18 - Prob. 30ECh. 18 - Balanced Scorecards and Strategy Maps Crane...Ch. 18 - TechMasters, Inc., has the following mission...Ch. 18 - Benchmarks Match each of the following specific...Ch. 18 - Benchmarks Match each of the following specific...Ch. 18 - Prob. 35ECh. 18 - Manufacturing Cycle Time and Efficiency Bell ...Ch. 18 - Prob. 37ECh. 18 - Partial Productivity Measures Looking for cost...Ch. 18 - Partial Productivity Measures As the cost...Ch. 18 - Prob. 40ECh. 18 - Prob. 41ECh. 18 - Specifying Nonfinancial Measures Write a memo to...Ch. 18 - Manufacturing Cycle Time and Efficiency A...Ch. 18 - Prob. 44ECh. 18 - Core Assets and Capabilities Consider the...Ch. 18 - Write a memo discussing the advantages of each...Ch. 18 - Balanced Scorecards and Strategy Maps Hill Street...Ch. 18 - Balanced Scorecards and Strategy Maps Monroe...Ch. 18 - Benchmarks Write a report to the CEO of Delta...Ch. 18 - Prob. 50PCh. 18 - Performance Measures, Drawing a Business Model...Ch. 18 - Performance Measures, Drawing a Business Model...Ch. 18 - Functional Measures Write a report to the...Ch. 18 - Prob. 54PCh. 18 - Operational Performance Measures Zuma Company...Ch. 18 - Objective and Subjective Performance Measures A...Ch. 18 - Operational Performance Measures Mid-States Metal...Ch. 18 - Prob. 58PCh. 18 - Prob. 59PCh. 18 - Prob. 60PCh. 18 - Balanced Scorecards and Strategy Maps Following...
Knowledge Booster


Learn more about
Need a deep-dive on the concept behind this application? Look no further. Learn more about this topic, accounting and related others by exploring similar questions and additional content below.Similar questions
- A Box Scorecard was prepared for a value stream: Required: 1. How many nonfinancial measures are used to evaluate performance? Why are nonfinancial measures used? 2. Classify the operational measures as time-based, quality-based, or efficiency-based. Discuss the significance of each category for lean manufacturing. 3. What is the role of the Planned Future State column? 4. Discuss the capacity category and explain the meaning of each measure and its significance. 5. Discuss the relationship between the financial measures and the measures in the operational and capacity categories.arrow_forwardInstructions 1.Based on the balanced scorecard and the following descriptions of the predicted relationships between strategic objectives, draw the scorecards strategy map. a.Training employees effectively and reducing employee turnover can both be expected to improve returns processing and reduce shipping errors. b.Both improving returns processing and reducing shipping errors can be expected to delight the customer. c.Delighting the customer can be expected to increase market share. 2.Based on the balanced scorecard and the following descriptions of the predicted relationships between performance metrics, draw the scorecards measure map. a.Median training hours per employee and average employee tenure will both influence hours from returned to refunded and number of erroneous shipments. b.Both hours from returned to refunded and number of erroneous shipments will affect percentage of customers who shop again and online customer satisfaction rating. c.Both percentage of customers who shop again and online customer satisfaction rating will influence the companys market share. 3.Label each element of the balanced scorecard.arrow_forwardThe following Box Scorecard was prepared for a value stream: Required: 1. How many nonfinancial measures are used to evaluate performance? Why are nonfinancial measures used? 2. Classify the operational measures as time-based, quality-based, or efficiency-based. Discuss the significance of each category for lean manufacturing. 3. What is the role of the Planned Future State column? 4. Discuss the capacity category and explain the meaning of each measure and its significance. 5. Discuss the relationship between the financial measures and the measures in the operational and capacity categories.arrow_forward
- Eye Swear Inc. has a balanced scorecard that includes the following relationships: Actual results for this year and last year are as follows: Instructions 1.Analyze these statistics to verify whether they support the expected relationships between the strategic objectives and performance metrics. 2.Identify three possible reasons for any unsupported relationship you identified in part (1). 3.Which of the three possibilities you identified in part (2) is the most likely reason for the unsupported relationship you identified in part (1)?arrow_forwardClassify each of the following performance measures into the balanced scorecard perspective to which it relates: financial perspective, internal operations perspective, learning and growth perspective, or customer perspective. A. Number of improved products B. Time from packaging to delivery or display C. Production costs D. Number of customer suggestions E. Sales mix revenues F. Number of repeat customersarrow_forwardConsider the following quality improvement strategy as expressed by a series of if-then statements: If real-time feedback information capabilities improve, then post-sales service time will improve. If post-sales service time improves, then post-sales service quality will increase. If post-sales service quality increases, then customer satisfaction will increase. If customer satisfaction increases, then market share will increase. If market share increases, then sales will increase. If sales increase, then profits will increase. Required: 1. Prepare a strategy map that shows the cause-and-effect relationships of the quality improvement strategy (see Exhibit 13.10 for an illustrative example). 2. Explain how the quality improvement strategy can be tested.arrow_forward
- Only help with parts c, g, I and J Scorecard Measures, Strategy Translation At the end of 20x1, Mejorar Company implemented a low-cost strategy to improve its competitive position. Its objective was to become the low-cost producer in its industry. A Balanced Scorecard was developed to guide the company toward this objective. To lower costs, Mejorar undertook a number of improvement activities such as JIT production, total quality management, and activity-based management. Now, after two years of operation, the president of Mejorar wants some assessment of the achievements. To help provide this assessment, the following information on one product has been gathered: 20x1 20x3 Theoretical annual capacity* 249,600 249,600 Actual production** 208,000 234,000 Market size (in units sold) 1,300,000 1,300,000 Production hours available (40 workers) 104,000 104,000 Very satisfied customers 83,200 117,000 Actual cost per unit $340 $272 Days of…arrow_forwardConstruct a balanced scorecard that would support MPC’s new manufacturing strategy. Use arrows toshow the causal links between the performance measures and show whether the performance measureshould increase or decrease over time. Feel free to create measures that may not be specificallymentioned in the chapter, but nonetheless make sense given the strategic goals of the company.arrow_forwardQ Canarsie Corporation uses a balanced scorecard to evaluate its digital camera manufacturing operation. Which of the following statements with respect to balanced scorecards is/are correct? I. A balanced scorecard reports management information regarding organizational performance in achieving goals classified by critical success factors to demonstrate that no single dimension of organizational performance can be relied upon to evaluate success. II. Performance measures used in a balanced scorecard tend to be divided into financial, customer, internal business process, and learning and growth. III. In a balanced scorecard, internal business processes are what the company does in its attempts to satisfy customers. 1. I and II only are correct. 2. II and III only are correct. 3. III only is correct. 4. I, II, and III are correctarrow_forward
- A. What are the four performance perspectives used in the balanced scorecard? B. For each performance perspective above, list at least two strategic objectives. 2. A balanced scorecard has the following performance metrics: Sales increase by region Sales order pipeline Market share Salesperson training hours Number of shipping errors Number of new customers New product development expenditures Relative to the metric “increase sales”, which of these performance metrics are leading and which are lagging indicators?arrow_forwardQuestion Content Area AnaCarolina and Jaco, accountants for Duke Manufacturing, are tasked with determining appropriate performance metrics for the financial perspective of Duke's balanced scorecard. Which of the following is the best metric for this situation? a. material price variance b. return on investment c. customer satisfaction rating d. operating throughoutarrow_forwardDescribing the balanced scorecard and identifying key performance indicators for each perspective Consider the following key performance indicators, and classify each indicator according to the balanced scorecard perspective it addresses. Choose from the financial perspective, customer perspective, internal business perspective, and the learning and growth perspective. Number of customer complaints Number of information system upgrades completed Residual income New product development time Employee turnover rate Percentage of products with online help manuals Customer retention Percentage of compensation based on performance Percentage of orders filled each week Gross margin growth Number of new patents Employee satisfaction ratings Manufacturing cycle time (average length of the production process) Earnings growth Average machine setup time Number of new customers Employee promotion rate Cash flow from operations Customer satisfaction ratings Machine downtime Finished products per…arrow_forward
arrow_back_ios
SEE MORE QUESTIONS
arrow_forward_ios
Recommended textbooks for you
 Principles of Accounting Volume 2AccountingISBN:9781947172609Author:OpenStaxPublisher:OpenStax College
 Financial And Managerial AccountingAccountingISBN:9781337902663Author:WARREN, Carl S.Publisher:Cengage Learning,
 Managerial AccountingAccountingISBN:9781337912020Author:Carl Warren, Ph.d. Cma William B. TaylerPublisher:South-Western College Pub
 Managerial Accounting: The Cornerstone of Busines...AccountingISBN:9781337115773Author:Maryanne M. Mowen, Don R. Hansen, Dan L. HeitgerPublisher:Cengage Learning
 Cornerstones of Cost Management (Cornerstones Ser...AccountingISBN:9781305970663Author:Don R. Hansen, Maryanne M. MowenPublisher:Cengage Learning
Principles of Accounting Volume 2
Accounting
ISBN:9781947172609
Author:OpenStax
Publisher:OpenStax College
Financial And Managerial Accounting
Accounting
ISBN:9781337902663
Author:WARREN, Carl S.
Publisher:Cengage Learning,
Managerial Accounting
Accounting
ISBN:9781337912020
Author:Carl Warren, Ph.d. Cma William B. Tayler
Publisher:South-Western College Pub
Managerial Accounting: The Cornerstone of Busines...
Accounting
ISBN:9781337115773
Author:Maryanne M. Mowen, Don R. Hansen, Dan L. Heitger
Publisher:Cengage Learning
Cornerstones of Cost Management (Cornerstones Ser...
Accounting
ISBN:9781305970663
Author:Don R. Hansen, Maryanne M. Mowen
Publisher:Cengage Learning
Why do we need accounting?; Author: EconClips;https://www.youtube.com/watch?v=weCXE2wIl90;License: Standard Youtube License