
Essentials Of Statistics For Business & Economics
9th Edition
ISBN: 9780357045435
Author: David R. Anderson, Dennis J. Sweeney, Thomas A. Williams, Jeffrey D. Camm, James J. Cochran
Publisher: South-Western College Pub
expand_more
expand_more
format_list_bulleted
Videos
Textbook Question
Chapter 2, Problem 49SE
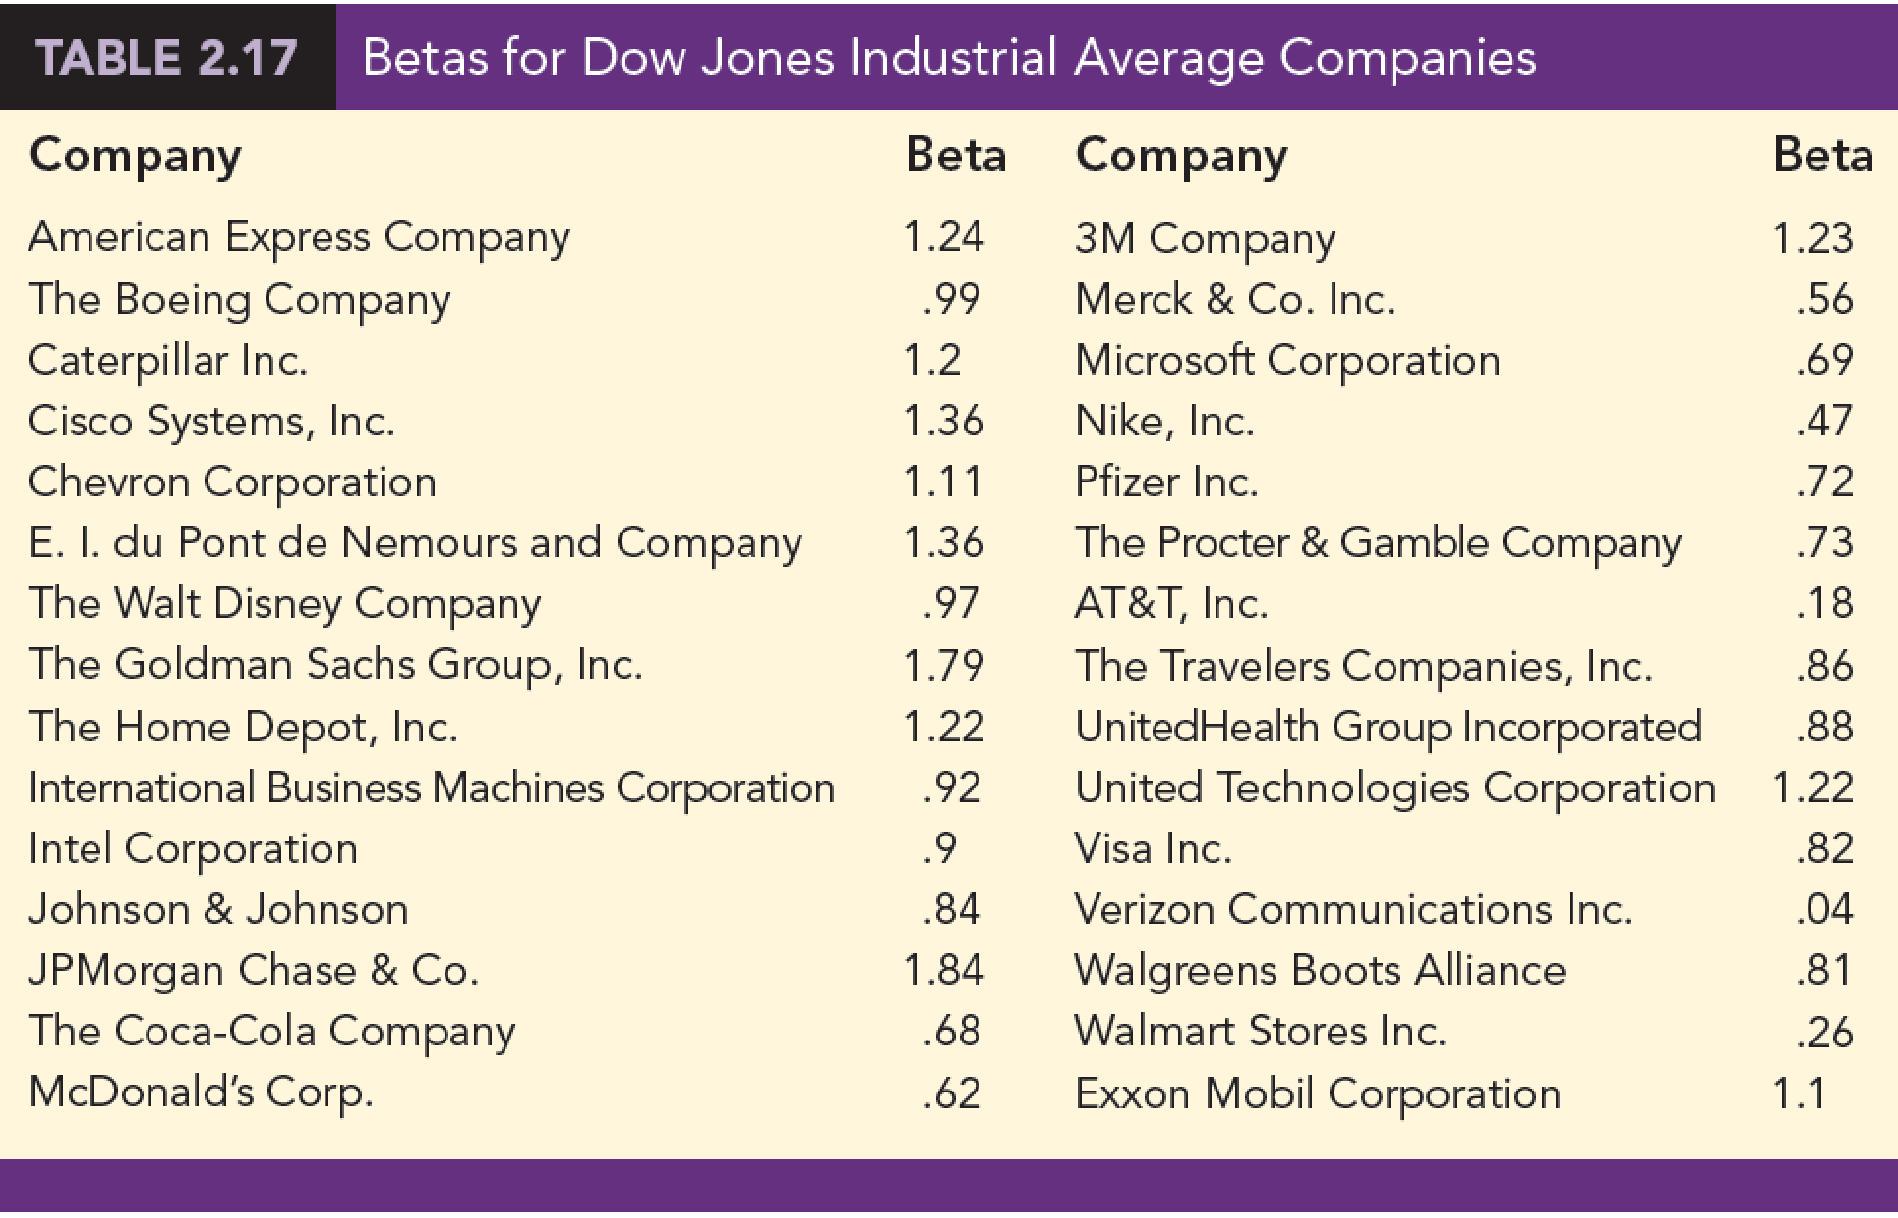
Stock Price Volatility. The term “beta” refers to a measure of a stock’s price volatility relative to the stock market as a whole. A beta of 1 means the stock’s price moves exactly with the market. A beta of 1.6 means the stock’s price would increase by 1.6% for an increase of 1% in the stock market. A larger beta means the stock price is more volatile. The beta values for the stocks of the companies that make up the Dow Jones Industrial Average are shown in Table 2.17 (Yahoo Finance).
- a. Construct a frequency distribution and percent frequency distribution.
- b. Construct a histogram.
- c. Comment on the shape of the distribution.
- d. Which stock has the highest beta? Which has the lowest beta?
Expert Solution & Answer

Trending nowThis is a popular solution!

Students have asked these similar questions
Stock A has a beta of 1.2 and Stock B has a beta of 1. The returns of Stock A are ______ sensitive to changes in the market as the returns of Stock B.
Stock y has a beta of 1.2 and an expected return of 11.5. Stock z has a beta of .80 and an expected return of 8.5 percent
A manager at an ice cream store is trying to determine how many customers to expect on any given day. Overall business has been relatively steady over the past several years, but the customer count seems to have ups and downs. He collects data over 30 days and records the number of customers, the high temperature (degrees Fahrenheit) and whether the day fell on a weekend.
Estimate: Customers =+ Temperature + Weekend +. Interpret the beta estimates.
How many customers should the manager expect on a Sunday with a forecasted high temperature of 80 degrees?
Interpret the weekend coefficient. Is it significant at the 5% level? How this affect the store’s staffing needs?
Customers
Temperature
Weekend
376
75
No
433
78
No
524
80
No
360
70
No
500
80
No
645
78
Yes
667
80
Yes
542
85
No
412
70
No
435
72
No
396
69
No
425
70
No
702
90
Yes
725
85
Yes
509
80
No
450
74
No
378
70
No
433
69
No
467
71
No
679
82
Yes
701
80
Yes
529
83
No
599
92
No
543
90…
Chapter 2 Solutions
Essentials Of Statistics For Business & Economics
Ch. 2.1 - The response to a question has three alternatives:...Ch. 2.1 - A partial relative frequency distribution is...Ch. 2.1 - A questionnaire provides 58 Yes, 42 No, and 20...Ch. 2.1 - Most Visited Websites. In a recent report, the top...Ch. 2.1 - Most Popular Last Names. In alphabetical order,...Ch. 2.1 - Top Rated Television Show Networks. Nielsen Media...Ch. 2.1 - Airline Customer Satisfaction Survey. Many...Ch. 2.1 - Data for a sample of 55 members of the Baseball...Ch. 2.1 - Degrees Awarded Annually. Nearly 1.9 million...Ch. 2.1 - Online Hotel Ratings. TripAdvisor is one of many...
Ch. 2.2 - Consider the following data. a. Develop a...Ch. 2.2 - Consider the following frequency distribution....Ch. 2.2 - Construct a histogram for the data in exercise 12....Ch. 2.2 - Consider the following data. a. Construct a dot...Ch. 2.2 - Construct a stem-and-leaf display for the...Ch. 2.2 - Construct a stem-and-leaf display for the...Ch. 2.2 - A doctor’s office staff studied the waiting times...Ch. 2.2 - NBA Total Player Ratings. CBSSports.com developed...Ch. 2.2 - Busiest North American Airports. Based on the...Ch. 2.2 - CEO Time in Meetings. The London School of...Ch. 2.2 - Largest University Endowments. University...Ch. 2.2 - Top U.S. Franchises. Entrepreneur magazine ranks...Ch. 2.2 - Engineering School Graduate Salaries. The file...Ch. 2.2 - Best Paying College Degrees. Each year America.EDU...Ch. 2.2 - Marathon Runner Ages. The Flying Pig is a marathon...Ch. 2.3 - The following data are for 30 observations...Ch. 2.3 - The following observations are for two...Ch. 2.3 - Daytona 500 Automobile Makes Average Speeds. The...Ch. 2.3 - Daytona 500 Average Speeds of Winners. The...Ch. 2.3 - Recently, management at Oak Tree Golf Course...Ch. 2.3 - Household Income Levels. The following...Ch. 2.3 - Values of World’s Most Valuable Brands. Each year...Ch. 2.3 - Revenue of World’s Most Valuable Brands. Refer to...Ch. 2.3 - Car Fuel Efficiencies. The U.S. Department of...Ch. 2.4 - The following 20 observations are for two...Ch. 2.4 - Consider the following data on two categorical...Ch. 2.4 - The following crosstabulation summarizes the data...Ch. 2.4 - Driving Speed and Fuel Efficiency. A study on...Ch. 2.4 - Low Temperatures and Snowfall. The file Snow...Ch. 2.4 - Hypertension and Heart Disease. People often wait...Ch. 2.4 - Smartphone Ownership. Consider the following...Ch. 2.4 - Store Managers Time Study. The Northwest regional...Ch. 2 - SAT Scores. The SAT is a standardized test used by...Ch. 2 - Median Household Incomes. The file MedianHousehold...Ch. 2 - State Populations. Data showing the population by...Ch. 2 - Startup Company Funds. According to the Wall...Ch. 2 - Complaints Reported to BBB. Consumer complaints...Ch. 2 - Stock Price Volatility. The term beta refers to a...Ch. 2 - Education Level and Household Income. The U.S....Ch. 2 - Western University has only one womens softball...Ch. 2 - Best Places to Work. Fortune magazine publishes an...Ch. 2 - Prob. 53SECh. 2 - Colleges’ Year Founded and Percent Graduated....Ch. 2 - Colleges’ Year Founded and Cost. Refer to the data...Ch. 2 - Colleges’ Cost and Percent Graduated. Refer to the...Ch. 2 - Electric Vehicle Sales. Electric plug-in vehicle...Ch. 2 - Zoo Member Types and Attendance. A zoo has...Ch. 2 - Pelican Stores, a division of National Clothing,...Ch. 2 - The movie industry is a competitive business. More...Ch. 2 - Cincinnati, Ohio, also known as the Queen City,...Ch. 2 - Jon Weideman, first shift foreman for Cut-Rate...
Knowledge Booster


Learn more about
Need a deep-dive on the concept behind this application? Look no further. Learn more about this topic, statistics and related others by exploring similar questions and additional content below.Similar questions
- Olympic Pole Vault The graph in Figure 7 indicates that in recent years the winning Olympic men’s pole vault height has fallen below the value predicted by the regression line in Example 2. This might have occurred because when the pole vault was a new event there was much room for improvement in vaulters’ performances, whereas now even the best training can produce only incremental advances. Let’s see whether concentrating on more recent results gives a better predictor of future records. (a) Use the data in Table 2 (page 176) to complete the table of winning pole vault heights shown in the margin. (Note that we are using x=0 to correspond to the year 1972, where this restricted data set begins.) (b) Find the regression line for the data in part ‚(a). (c) Plot the data and the regression line on the same axes. Does the regression line seem to provide a good model for the data? (d) What does the regression line predict as the winning pole vault height for the 2012 Olympics? Compare this predicted value to the actual 2012 winning height of 5.97 m, as described on page 177. Has this new regression line provided a better prediction than the line in Example 2?arrow_forwardIf the value of Cronbach’s alpha is 0.07, it means ___________; a. Research instrument is not reliable b. Research instrument is internally consistent c. Data is reliable d. Data is internally consistentarrow_forwardon the basis of the value of linear correlation coefficient, would you conclude, at the /r/>0.9 level, that the data can be reasonably modeled linear equation?arrow_forward
- An experiment is conducted to see the effect of light intensity on plant growth, what is the dependent variable in this scenario?arrow_forwardA sample of n = 15 pairs of X and Y scores produces a Pearson correlation of r = 0.45, SSY = 90. a) If the regression equation was found for these scores, how much of the Y variability would be predicted by the regression equation (SSregression) and how much would not be predicted (SSresidual)? b) Does the regression equation predict a significant portion of the variability for the Y scores? (Equivalently, is the Pearson correlation significant?)arrow_forwardCompute the forecasted values for Yt for July and August in 2020 by using the modelsstated in (c) and (d)arrow_forward
- Note- bolded quiz have already answered A possible important environmental determinant of lung function in children is the amount of cigarette smoking in the home. Suppose this question is studied by selecting two groups: Group 1 consists of 23 nonsmoking children 5-9 years of age, both of whose parents smoke, who have a mean forced expiratory volume (FEV) of 2.1 L and a standard deviation of 0.7 L; group 2 consists of 20 nonsmoking children of comparable age, neither of whose parents smoke, who have a mean FEV of 2.3 L and a standard deviation of 0.4 L.*8.31 What are the appropriate null and alternative hypotheses to compare the means of the two groups? *8.32 What is the appropriate test procedure for the hypotheses in Problem 8.31? *8.33 Carry out the test in Problem 8.32 using the criticalvalue method. *8.34 Provide a 95% CI for the true mean difference in FEV between 5- to 9-year-old children whose parents smoke and comparable children whose parents do not smoke. *8.35 Assuming…arrow_forwardA dentist wanted to determine if a relationship existed between childhood fluoride exposure and cavities. She took a sample of adults in her practice and counted how many cavities each person had in his or her permanent teeth. She also determined how many years of childhood each person was exposed to tap water with fluoride. The minimum value on this variable was 0 and the maximum was 18. Using the data below, an alpha of .05 and a two-tailed test, was there a significant relationship? Years of fluoride Number of cavities 0 10 18 1 2 7 12 3 3 4 10 5 M = 7.5s =6.98 M = 5.00s = 3.16arrow_forwardIf the variable “Attractiveness” increases and the variable “Weight” appears to go down, we would say the correlation is: A) Zero B) Positive C) Negative D) Impossible to determine.arrow_forward
arrow_back_ios
arrow_forward_ios
Recommended textbooks for you
 College AlgebraAlgebraISBN:9781305115545Author:James Stewart, Lothar Redlin, Saleem WatsonPublisher:Cengage Learning
 Linear Algebra: A Modern IntroductionAlgebraISBN:9781285463247Author:David PoolePublisher:Cengage Learning
 Glencoe Algebra 1, Student Edition, 9780079039897...AlgebraISBN:9780079039897Author:CarterPublisher:McGraw Hill
College Algebra
Algebra
ISBN:9781305115545
Author:James Stewart, Lothar Redlin, Saleem Watson
Publisher:Cengage Learning
Linear Algebra: A Modern Introduction
Algebra
ISBN:9781285463247
Author:David Poole
Publisher:Cengage Learning
Glencoe Algebra 1, Student Edition, 9780079039897...
Algebra
ISBN:9780079039897
Author:Carter
Publisher:McGraw Hill
Solve ANY Optimization Problem in 5 Steps w/ Examples. What are they and How do you solve them?; Author: Ace Tutors;https://www.youtube.com/watch?v=BfOSKc_sncg;License: Standard YouTube License, CC-BY
Types of solution in LPP|Basic|Multiple solution|Unbounded|Infeasible|GTU|Special case of LP problem; Author: Mechanical Engineering Management;https://www.youtube.com/watch?v=F-D2WICq8Sk;License: Standard YouTube License, CC-BY
Optimization Problems in Calculus; Author: Professor Dave Explains;https://www.youtube.com/watch?v=q1U6AmIa_uQ;License: Standard YouTube License, CC-BY
Introduction to Optimization; Author: Math with Dr. Claire;https://www.youtube.com/watch?v=YLzgYm2tN8E;License: Standard YouTube License, CC-BY