
Concept explainers
Videos
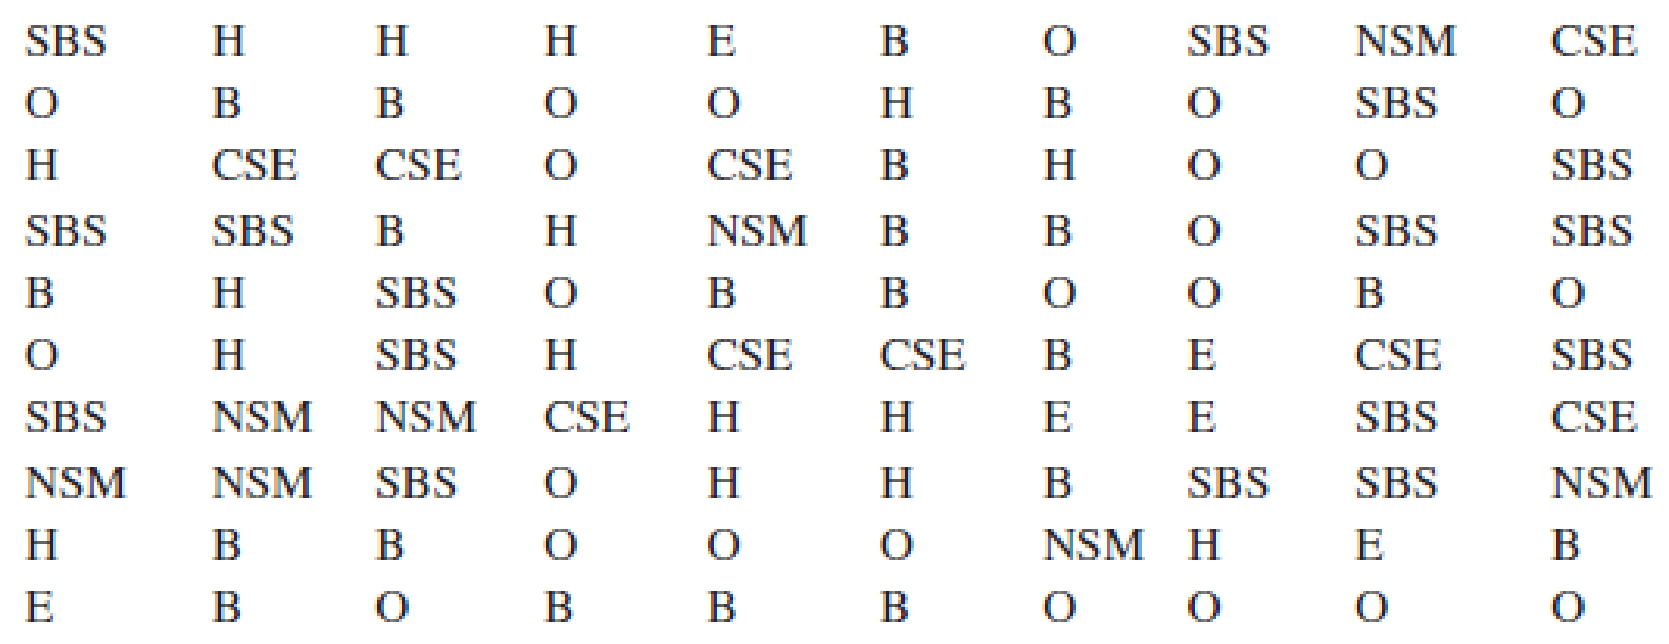
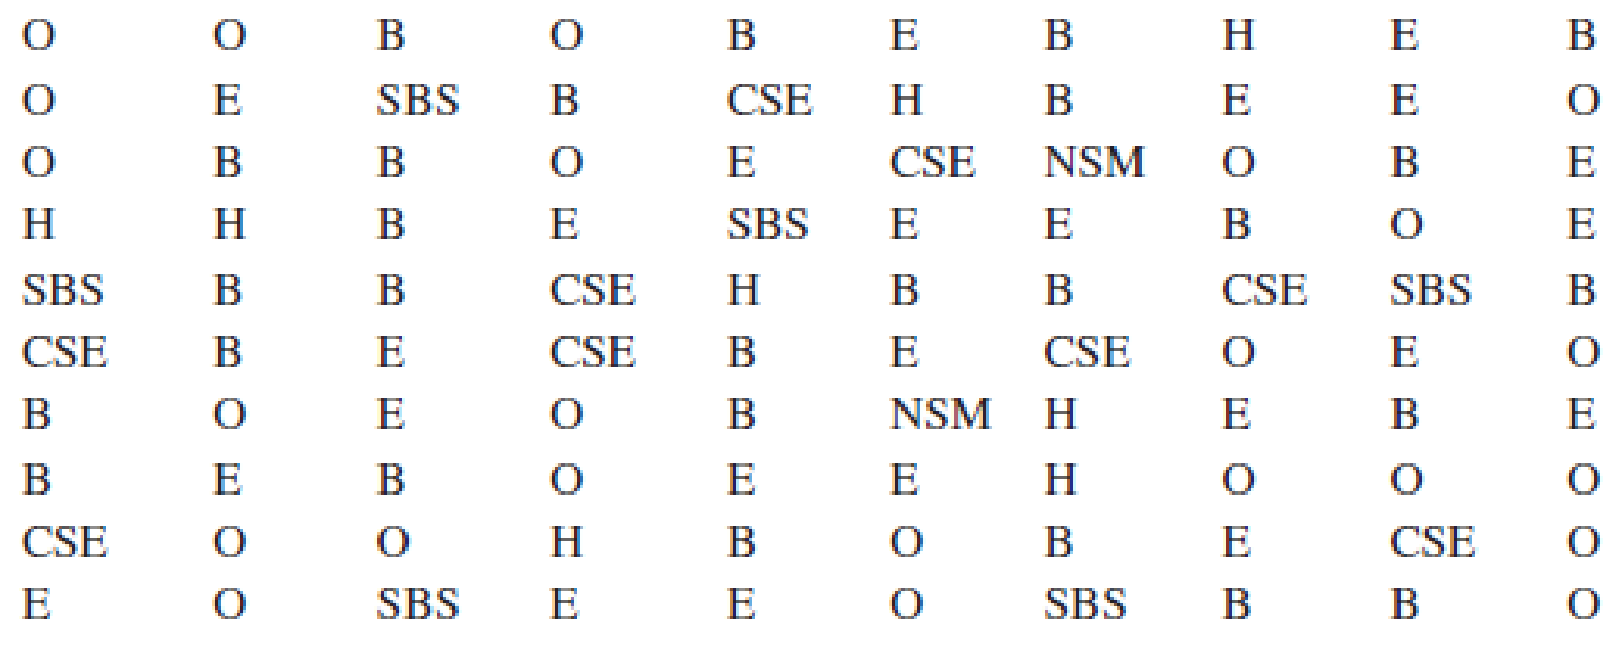
Degrees Awarded Annually. Nearly 1.9 million bachelor’s degrees and over 758,000 master’s degrees are awarded annually by U.S. postsecondary institutions as of 2018 (National Center for Education Statistics website). The Department of Education tracks the field of study for these graduates in the following categories: Business (B), Computer Sciences and Engineering (CSE), Education (E), Humanities (H), Natural Sciences and Mathematics (NSM), Social and Behavioral Sciences (SBS), and Other (O). Consider the following samples of 100 graduates:
Bachelor’s Degree Field of Study
Master’s Degree Field of Study
- a. Provide a percent frequency distribution of field of study for each degree.
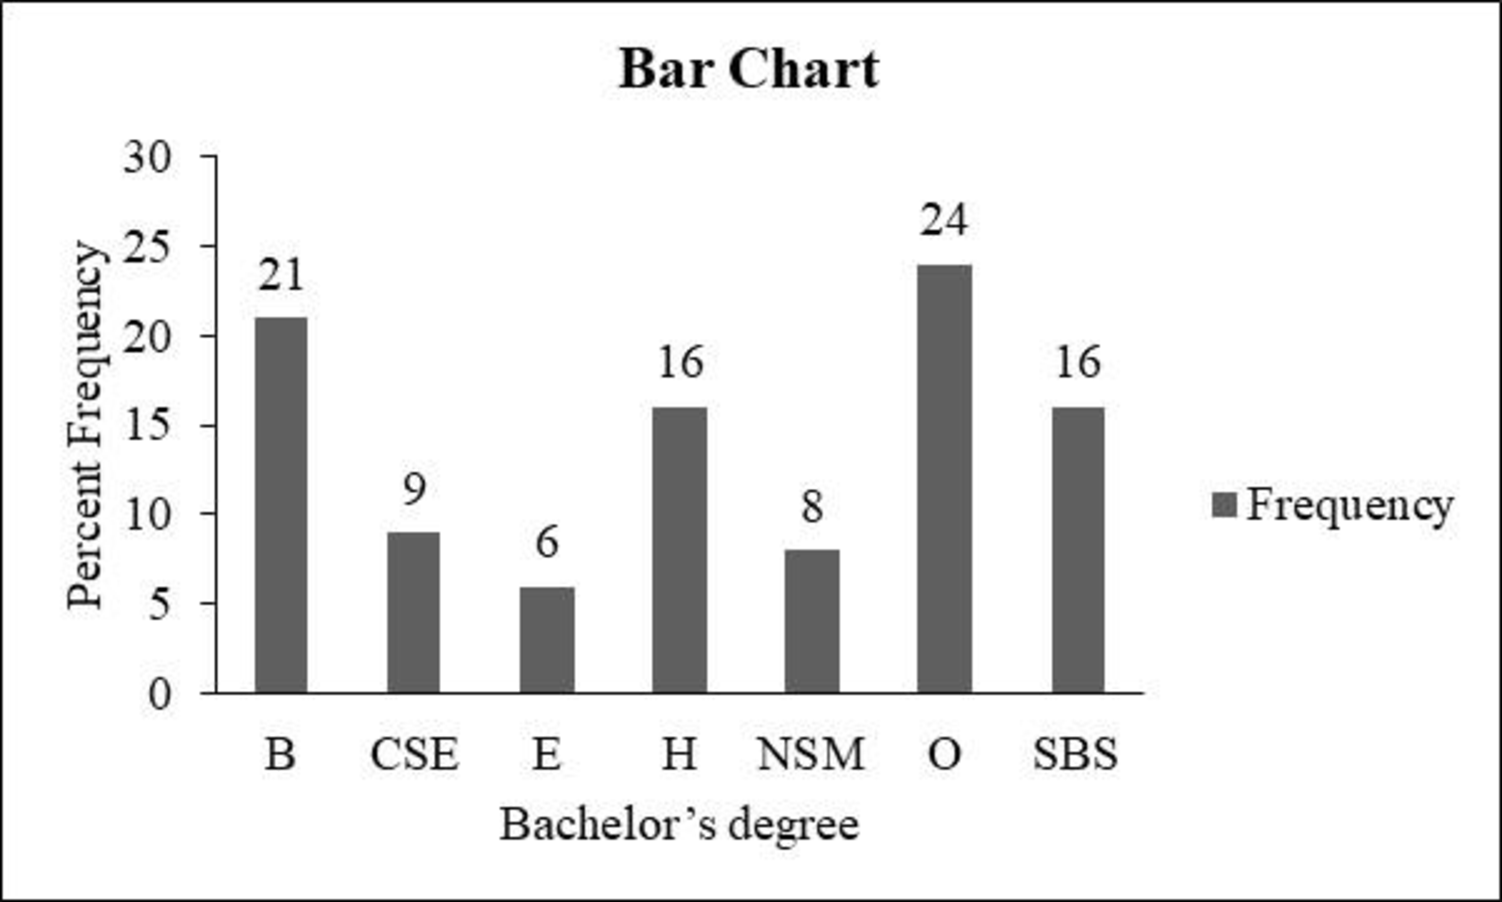
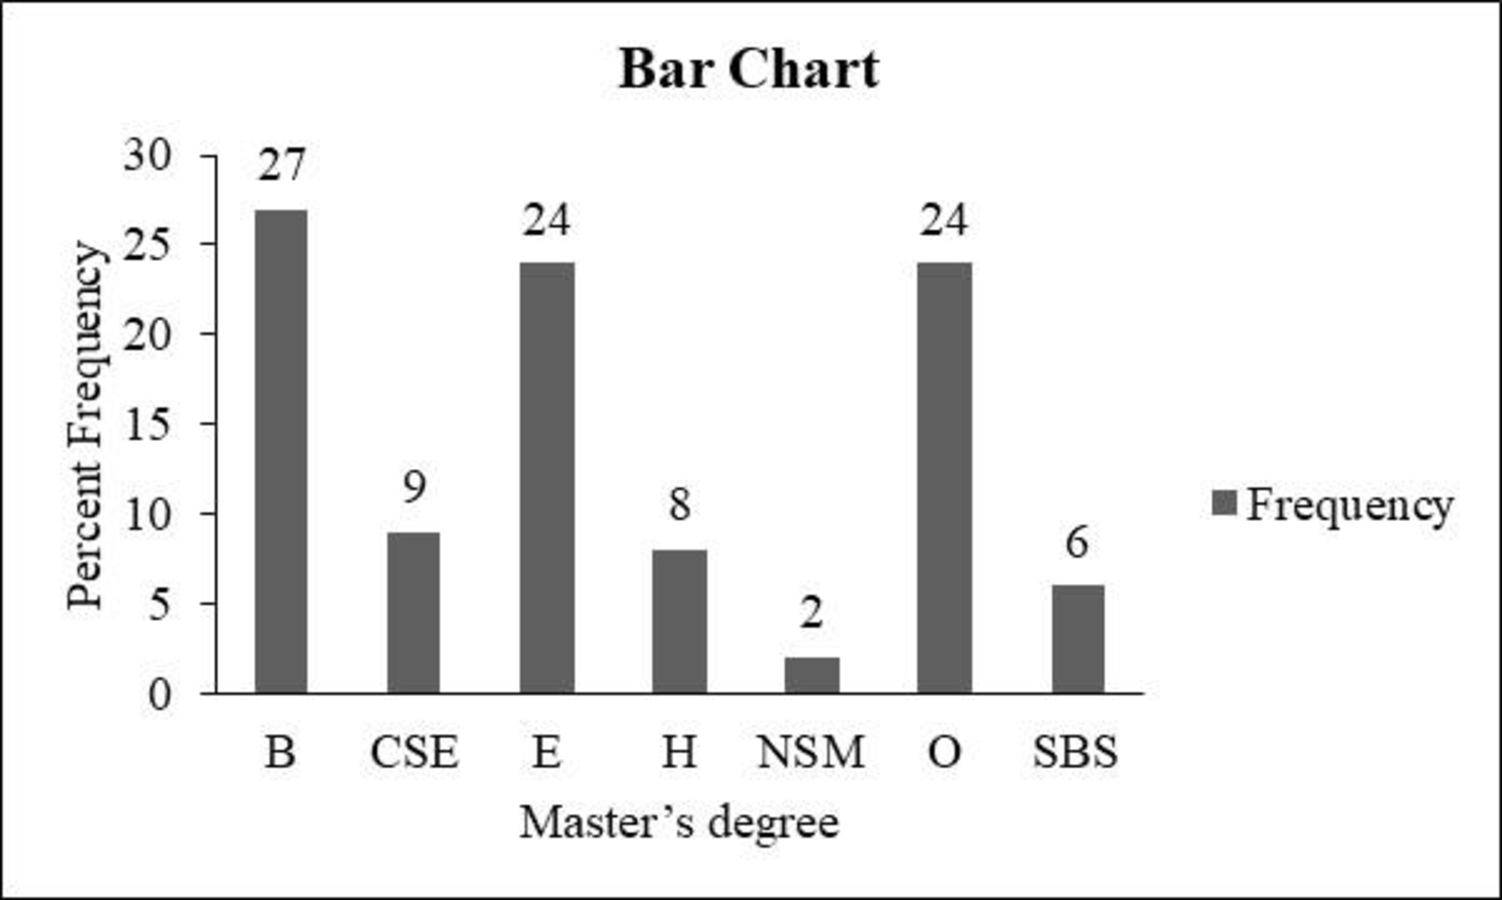
- b. Construct a bar chart for field of study for each degree.
- c. What is the lowest percentage field of study for each degree?
- d. What is the highest percentage field of study for each degree?
- e. Which field of study has the largest increase in percentage from bachelor’s to masters’?
a.
Construct the percent frequency distribution of the field of study for each degree.
Answer to Problem 9E
The percent frequency distribution for bachelor’s degree is given below:
| Bachelor’s degree | Percent frequency |
| B | 21% |
| CSE | 9% |
| E | 6% |
| H | 16% |
| NSM | 8% |
| O | 24% |
| SBS | 16% |
| Total | 100 |
The percent frequency distribution for master’s degree is given below:
| Master’s degree | Percent frequency |
| B | 27% |
| CSE | 9% |
| E | 24% |
| H | 8% |
| NSM | 2% |
| O | 24% |
| SBS | 6% |
| Total | 100 |
Explanation of Solution
Calculation:
The data represent the U.S postsecondary institutions that provide the annual awards for the 1.9 million bachelor’s degrees and the 758,000 master’s degrees. The graduate categories are Business (B), Computer science and Engineering (CSE), Education (E), Humanities (H), Natural sciences and Mathematics (NSM), Social and Behavioral sciences (SBS), and other (O).
For Bachelor’s degree:
Frequency:
The frequencies are calculated using the tally marks. Here, the number of times each class repeats is the frequency of that particular class.
Here, “B (business)” is the department type data, which is repeated 21 times in the data set, and thus, 21 is the frequency for the category “business (B)”.
Similarly, the frequency of the remaining types of network is given below:
| Bachelor’s degree | Tally | Frequency |
| B | 21 | |
| CSE | 9 | |
| E | 6 | |
| H | 16 | |
| NSM | 8 | |
| O | 24 | |
| SBS | 16 | |
| Total | 100 |
Relative frequency:
The general formula for the relative frequency is given below:
Therefore,
Similarly, the relative frequencies for the remaining types of class are obtained below:
| Bachelor’s degree | Frequency | Relative frequency |
| B | 21 | 0.21 |
| CSE | 9 | |
| E | 6 | |
| H | 16 | |
| NSM | 8 | |
| O | 24 | |
| SBS | 16 | |
| Total | 100 | 1.00 |
Percentage frequency distribution:
The general formula for the percent frequency is given below:
Therefore,
The percent frequencies for the remaining categories of education fields for bachelor degree are obtained below:
| Bachelor’s degree | Relative frequency | Percent frequency |
| B | 0.21 | 21% |
| CSE | 0.09 | |
| E | 0.06 | |
| H | 0.16 | |
| NSM | 0.08 | |
| O | 0.24 | |
| SBS | 0.16 | |
| Total | 1.00 | 100 |
For master’s degree:
Here, “B (business)” is the department type data, which is repeated 27 times in the data set, and thus, 27 is the frequency for the category “business (B)”.
Similarly, the frequency of the remaining types of department fields is given below:
| Master’s degree | Tally | Frequency |
| B | 27 | |
| CSE | 9 | |
| E | 24 | |
| H | 8 | |
| NSM | 2 | |
| O | 24 | |
| SBS | 6 | |
| Total | 100 |
Relative frequency:
Similarly, the relative frequencies for the remaining types of department fields are obtained below:
| Master’s degree | Frequency | Relative frequency |
| B | 27 | 0.27 |
| CSE | 9 | |
| E | 24 | |
| H | 8 | |
| NSM | 2 | |
| O | 24 | |
| SBS | 6 | |
| Total | 100 | 1.00 |
Percentage frequency distribution:
The percent frequencies for the remaining types of categories of education fields for master’s degree are obtained below:
| Master’s degree | Relative frequency | Percent frequency |
| B | 0.27 | 27% |
| CSE | 0.09 | |
| E | 0.24 | |
| H | 0.08 | |
| NSM | 0.02 | |
| O | 0.24 | |
| SBS | 0.06 | |
| Total | 1.00 | 100 |
b.
Construct the bar chart for each degree.
Answer to Problem 9E
Output obtained from Excel for bachelor’s degree is given below:
Output obtained from Excel for Master’s degree is given below:
Explanation of Solution
Calculation:
For Bachelor’s degree:
Software procedure:
Step-by-step procedure to draw the bar chart for bachelor’s degree using Excel:
- In Excel sheet, enter Bachelor’s degree in one column and Frequency in another column.
- Select the data and then choose Insert > Insert Column Bar Charts.
- Select Clustered Column Under More Column Charts.
- For master’s degree:
Software procedure:
Step-by-step procedure to draw the bar chart for master’s degree using Excel:
- In Excel sheet, enter Master’s degree in one column and Frequency in another column.
- Select the data and then choose Insert > Insert Column Bar Charts.
- Select Clustered Column Under More Column Charts.
c.
Find the lowest percentage field of study for each degree.
Answer to Problem 9E
The lowest percentage for a bachelor’ degree is Education.
The lowest percentage for a master’s degree is Natural sciences and Mathematics.
Explanation of Solution
For bachelor’ degree, the percentage for education is 6%, which is low when compared to the other categories.
For master’s degree, the percentage for Natural science and Mathematics is 2%, which is low when compared to other categories.
d.
Find the highest percentage field of study for each degree.
Answer to Problem 9E
The highest percentage field of study for a bachelor’ degree is Others.
The highest percentage field of study for a master’s degree is Business.
Explanation of Solution
For bachelor’ degree, the percentage for others is 24%, which is high when compared to the other categories.
For master’s degree, the percentage for business is 27%, which is high when compared to the other categories.
e.
Identify the field of study that has the largest increase in percentage from bachelor’s to masters’ degree.
Answer to Problem 9E
The field of study “Education” has the largest increase in percentage from bachelor’s to masters’ degree.
Explanation of Solution
Calculation:
In order to obtain the study field that has the largest increase in percentage from the bachelor’s to master’s degree, the difference between the two respective percentages should be found.
Therefore,
The differences between the two fields are tabulated below:
| Field | Bachelor’s | Master’s | Difference |
| B | 21% | 27% | 6% |
| CSE | 9% | 9% | 0% |
| E | 6% | 24% | 18% |
| H | 16% | 8% | 8% |
| NSM | 8% | 2% | 6% |
| O | 24% | 24% | 0% |
| SBS | 16% | 6% | 10% |
From the table, it is observed that the field of study “Education” has the largest increase in percentage from bachelor’s to master’s degree.
Want to see more full solutions like this?
Chapter 2 Solutions
Essentials Of Statistics For Business & Economics


 MATLAB: An Introduction with ApplicationsStatisticsISBN:9781119256830Author:Amos GilatPublisher:John Wiley & Sons Inc
 Probability and Statistics for Engineering and th...StatisticsISBN:9781305251809Author:Jay L. DevorePublisher:Cengage Learning
 Statistics for The Behavioral Sciences (MindTap C...StatisticsISBN:9781305504912Author:Frederick J Gravetter, Larry B. WallnauPublisher:Cengage Learning
 Elementary Statistics: Picturing the World (7th E...StatisticsISBN:9780134683416Author:Ron Larson, Betsy FarberPublisher:PEARSON
 The Basic Practice of StatisticsStatisticsISBN:9781319042578Author:David S. Moore, William I. Notz, Michael A. FlignerPublisher:W. H. Freeman
 Introduction to the Practice of StatisticsStatisticsISBN:9781319013387Author:David S. Moore, George P. McCabe, Bruce A. CraigPublisher:W. H. Freeman