
Concept explainers
Videos
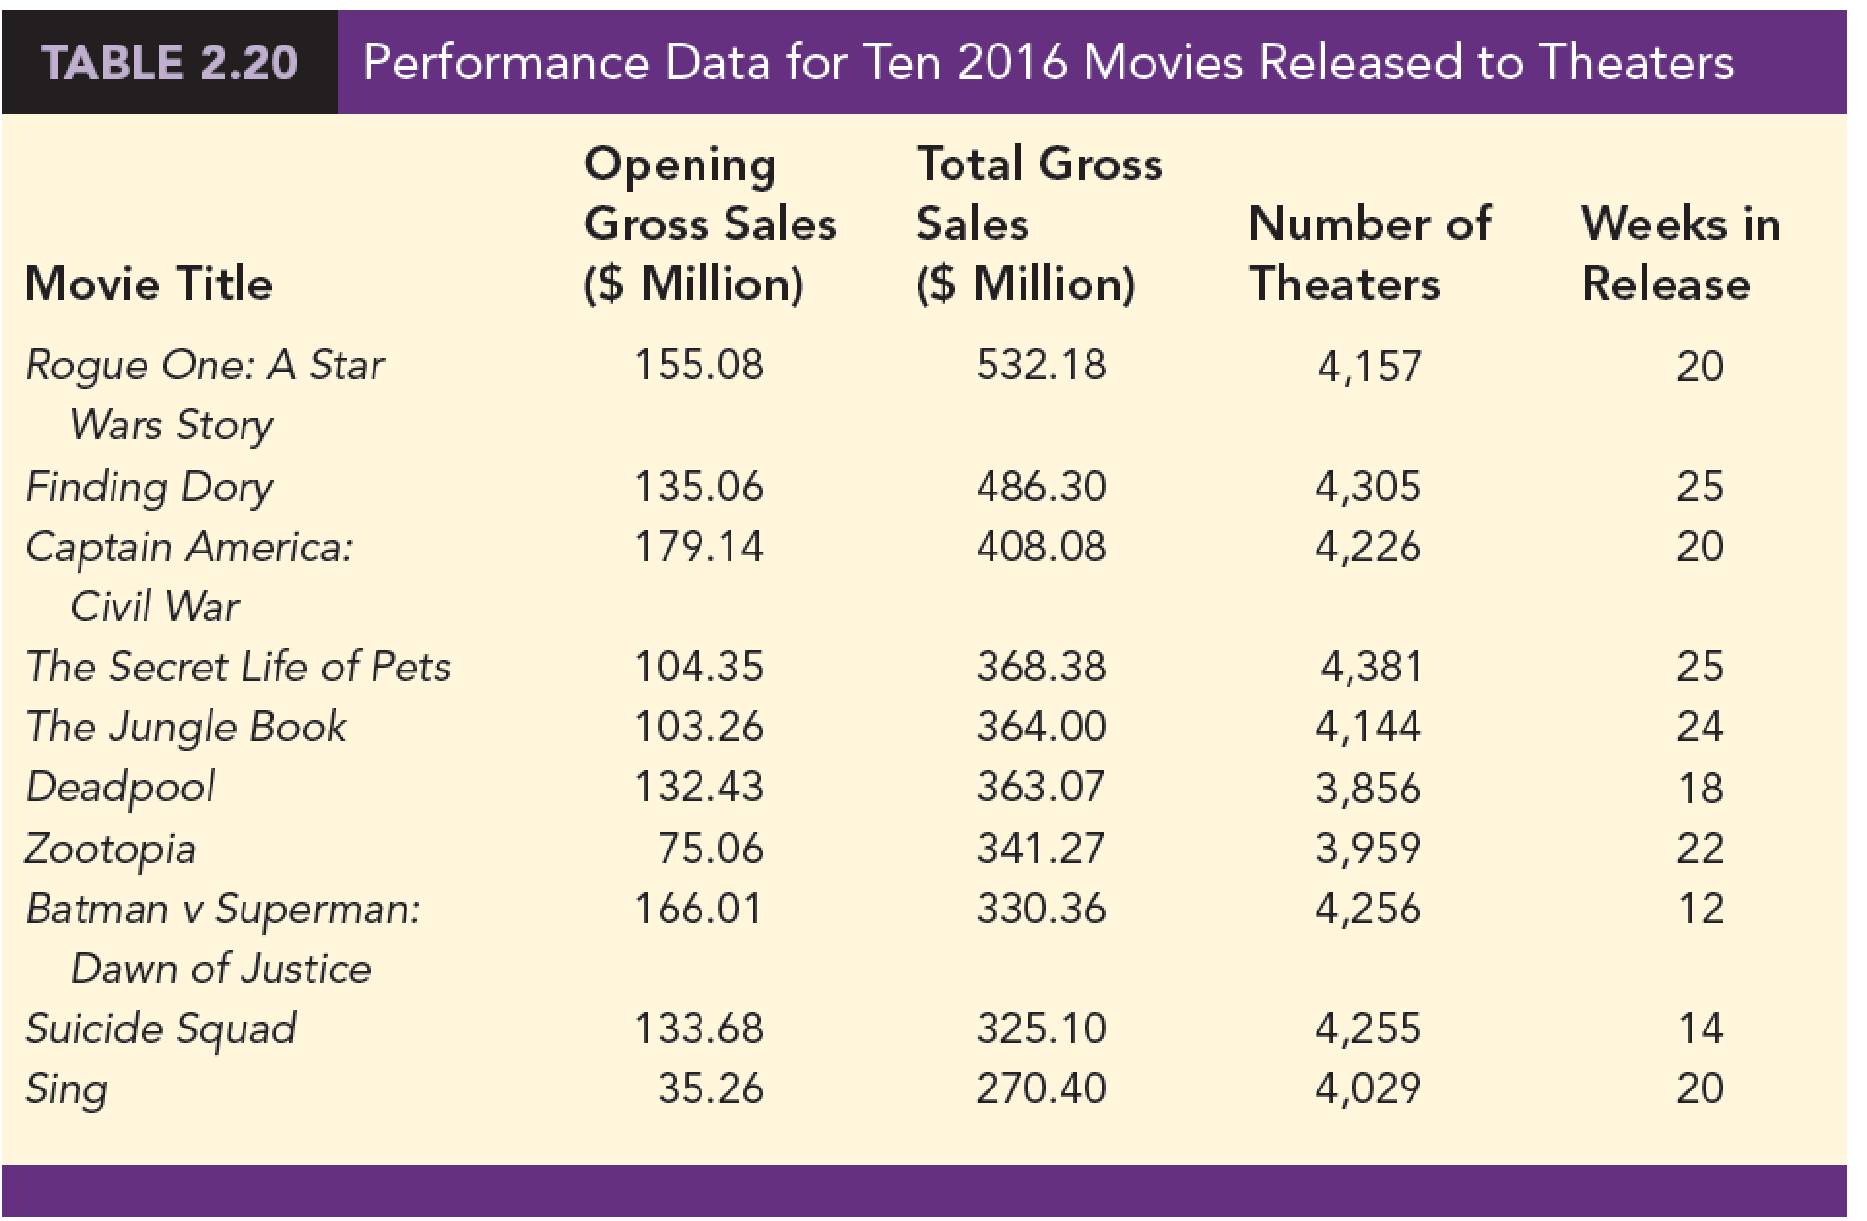
The movie industry is a competitive business. More than 50 studios produce hundreds of new movies for theater release each year, and the financial success of each movie varies considerably. The opening weekend gross sales ($ millions), the total gross sales ($ millions), the number of theaters the movie was shown in, and the number of weeks the movie was in release are common variables used to measure the success of a movie released to theaters. Data collected for the top 100 theater movies released in 2016 are contained in the file Movies2016 (Box Office Mojo website). Table 2.20 shows the data for the first 10 movies in this file.
Managerial Report
Use the tabular and graphical methods of
- 1. Tabular and graphical summaries for each of the four variables along with a discussion of what each summary tells us about the movies that are released to theaters.
- 2. A
scatter diagram to explore the relationship between Total Gross Sales and Opening Weekend Gross Sales. Discuss.
- 3. A scatter diagram to explore the relationship between Total Gross Sales and Number of Theaters. Discuss.
- 4. A scatter diagram to explore the relationship between Total Gross Sales and Number of Weeks in Release. Discuss.

Trending nowThis is a popular solution!

Chapter 2 Solutions
Essentials Of Statistics For Business & Economics


- Which rate best represents the relationship between the number of players and the number of fieldsarrow_forwardHow many levels does the independent variable havearrow_forwardA study was done to see whether getting radio airtime and spending money on advertisements accurately predicts the number of album copies sold. A random sample of 200 artists’ albums were tracked on the number of times their songs play on the central radio station, how much money (in thousands) they spent on advertisements, as well as the number (in thousands) of album copies were sold. A record company wanted to determine if there was a positive relationship between album sales and the other two variables (money spent on advertisements and number of albums sold) sales advertisements airtime 330 10.256 43 120 985.685 28 360 1445.56 35 270 1188.19 33 220 574.513 44 170 568.954 19 70 471.814 20 210 537.352 22 200 514.068 21 300 174.093 40 290 1720.81 32 70 611.479 20 150 251.192 24 190 97.972 38 240 406.814 24 100 265.398 25 250 1323.29 35…arrow_forward
- A study was done to see whether getting radio airtime and spending money on advertisements accurately predicts the number of album copies sold. A random sample of 200 artists’ albums were tracked on the number of times their songs play on the central radio station, how much money (in thousands) they spent on advertisements, as well as the number (in thousands) of album copies were sold. A record company wanted to determine if there was a positive relationship between album sales and the other two variables (money spent on advertisements and number of albums sold). 1. Proposed analysis and why you chose the analysis 2. Measurement type (i.e., nominal, ordinal, continuous) for variable(s) that will be used in the analysis 3. Null and alternative hypotheses (based on context of study) in symbols 4. Test assumptions and make a decision (please provide written evidence to support your decision) 5. Inferential statistic(s) and p-value(s) 6. Decision 7. Conclusion 8. Based on your decision,…arrow_forwardA study was done to see whether getting radio airtime and spending money on advertisements accurately predicts the number of album copies sold. A random sample of 200 artists’ albums were tracked on the number of times their songs play on the central radio station, how much money (in thousands) they spent on advertisements, as well as the number (in thousands) of album copies were sold. A record company wanted to determine if there was a positive relationship between album sales and the other two variables (money spent on advertisements and number of albums sold) sales advertisements airtime 330 10.256 43 120 985.685 28 360 1445.56 35 270 1188.19 33 220 574.513 44 170 568.954 19 70 471.814 20 210 537.352 22 200 514.068 21 300 174.093 40 290 1720.81 32 70 611.479 20 150 251.192 24 190 97.972 38 240 406.814 24 100 265.398 25 250 1323.29 35…arrow_forwardA study was done to see whether getting radio airtime and spending money on advertisements accurately predicts the number of album copies sold. A random sample of 200 artists’ albums were tracked on the number of times their songs play on the central radio station, how much money (in thousands) they spent on advertisements, as well as the number (in thousands) of album copies were sold. A record company wanted to determine if there was a positive relationship between album sales and the other two variables (money spent on advertisements and number of albums sold) sales advertisements airtime 330 10.256 43 120 985.685 28 360 1445.56 35 270 1188.19 33 220 574.513 44 170 568.954 19 70 471.814 20 210 537.352 22 200 514.068 21 300 174.093 40 290 1720.81 32 70 611.479 20 150 251.192 24 190 97.972 38 240 406.814 24 100 265.398 25 250 1323.29 35 210 196.65 36 280 1326.6 27 230 1380.69 33 210 792.345 33 230 957.167 28 320 1789.66 30 210…arrow_forward
- A study was done to see whether getting radio airtime and spending money on advertisements accurately predicts the number of album copies sold. A random sample of 200 artists’ albums were tracked on the number of times their songs play on the central radio station, how much money (in thousands) they spent on advertisements, as well as the number (in thousands) of album copies were sold. A record company wanted to determine if there was a positive relationship between album sales and the other two variables (money spent on advertisements and number of albums sold). Sales, Advertisements, Airtime 330 10.256 43 120 985.685 28 360 1445.56 35 270 1188.19 33 220 574.513 44 170 568.954 19 70 471.814 20 210 537.352 22 200 514.068 21 300 174.093 40 290 1720.81 32 70 611.479 20 150 251.192 24 190 97.972 38 240 406.814 24 100 265.398 25 250 1323.29 35 210 196.65 36 280 1326.6 27 230 1380.69 33 210 792.345 33 230 957.167 28 320 1789.66 30 210…arrow_forwardAn auto parts store operated 3549 stores in 2004. By 2007, the auto parts store operated 4140 stores. Assuming the number of stores followed a linear pattern, how many stores would they have operated in 2010?arrow_forwardcan a cause and effect relationship be determined?arrow_forward
- Explain if two variables consist of nominal data?arrow_forwardFor an article in a magazine, 20 different vehicles were selected to obtain data for comparison. From each vehicle the price in dollars, the fuel economy (in miles per gallon), the number of doors, the type of vehicle (car, truck, SUV, other), and if it had all wheel drive or not. a. What are the cases? b. List the variables and identify them as quantitative or categorical.arrow_forwardCollege students and surfers Rex Robinson and Sandy Hudson collected data on the self-reported number of days surfed in a month for 30 longboard surfers and 30 shortboard surfers. Complete parts a and b below.arrow_forward
 College Algebra (MindTap Course List)AlgebraISBN:9781305652231Author:R. David Gustafson, Jeff HughesPublisher:Cengage Learning
 Algebra: Structure And Method, Book 1AlgebraISBN:9780395977224Author:Richard G. Brown, Mary P. Dolciani, Robert H. Sorgenfrey, William L. ColePublisher:McDougal Littell
 Algebra & Trigonometry with Analytic GeometryAlgebraISBN:9781133382119Author:SwokowskiPublisher:Cengage
 Glencoe Algebra 1, Student Edition, 9780079039897...AlgebraISBN:9780079039897Author:CarterPublisher:McGraw Hill
 Big Ideas Math A Bridge To Success Algebra 1: Stu...AlgebraISBN:9781680331141Author:HOUGHTON MIFFLIN HARCOURTPublisher:Houghton Mifflin Harcourt