
Videos
A vendor at a local baseball stadium must determine whether to sell ice cream or soft drinks at today’s game. The vendor believes that the profit made will depend on the weather. The payoff table (in
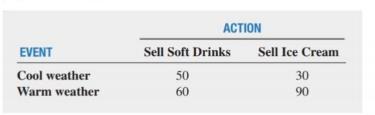
Based on her past experience at this time of year, the vendor estimates the
a. Determine the optimal action based on the maximax criterion.
b. Determine the optimal action based on the maximax criterion.
c. Compute the expected monetary value (EMV) for selling soft drinks and selling ice cream.
d. Compute the expected opportunity loss (EOL) for selling soft drinks and selling ice cream.
e. Explain the meaning of the
f. Based on the results of (c) or (d), which would you choose to sell. soft drinks or ice cream? Why?
g. Compute the coefficient of variation for selling soft drinks and selling ice cream.
h. Compute the return-to-risk ratio (RTRR) for selling soft drinks and selling ice cream.
i. Based on (g) and (h). what would you choose to sell, soft drinks or ice cream? Why?
j. Compare the results of (f) and (i) and explain any differences.
Want to see the full answer?
Check out a sample textbook solution
Chapter 20 Solutions
Basic Business Statistics Student Value Edition Plus NEW MyLab Statistics with Pearson eText -- Access Card Package (13th Edition)


- ABC Construction Company is going to decide whether they are going to expand their business, build an additional facility, or subcontract a partner company. The research and development department forecasted the following payoff values which are summarized in the table below. The values are expressed as GAINS and alpha = 0.6. Come up with a decision using the different criteria under conditions of uncertainty:arrow_forwardThe recent economic downturn resulted in the loss of jobs and an increase in delinquentloans for housing. In projecting where the real estate market was headed in the comingyear, economists studied the relationship between the jobless rate and the percentage ofdelinquent loans. The expectation was that if the jobless rate continued to increase, therewould also be an increase in the percentage of delinquent loans. The following data showthe jobless rate and the delinquent loan percentage for 27 major real estate markets. a. Compute the correlation coefficient. Is there a positive correlation between the joblessrate and the percentage of delinquent housing loans? What is your interpretation?b. Show a scatter diagram of the relationship between the jobless rate and the percentagearrow_forwardThe Harriet Hotel in downtown Boston has 100 rooms that rent for $150 per night. It costs the hotel $30 per room in variable costs (cleaning, bathroom items, etc.) each night a room is occupied. For each reservation accepted, there is a 5% chance that the guest will not arrive. If the hotel overbooks, it costs $200 to compensate guests whose reservations cannot be honored. How many reservations should the hotel accept if it wants to maximize the average daily profit?arrow_forward
- A driver’s age has something to do with his or her chance of getting into a fatal car crash. The bar graph shows the number of fatal vehicle crashes per 100 million miles driven for drivers of various age groups. For example, 25-year-old drivers are involved in 4.1 fatal crashes per 100 million miles driven. Thus, when a group of 25-year-old Americans have driven a total of 100 million miles, approximately 4 have been in accidents in which someone died. The number of fatal vehicle crashes per 100 million miles, y, for drivers of age x can be modeled by the formula : y = 0.013x2 - 1.19x + 28.24. Use the formula above and the bar graph at the bottom of the previous page to solve, What age groups are expected to be involved in 3 fatal crashes per 100 million miles driven? How well does the formula model the trend in the actual data shown in the bar graph?arrow_forwardThe National Highway Association is studying the relationship between the number of bidders on a highway project and the winning (lowest) bid for the project. Of particular interest is whether the number of bidders increases or decreases the amount of the winning bid. Bidders Price 9.0 5.1 9.0 8.0 3.0 9.7 10.0 7.8 5.0 7.7 10.0 5.5 7.0 8.3 11.0 5.5 6.0 10.3 6.0 8.0 4.0 8.8 7.0 9.4 7.0 8.6 7.0 8.1 6.0 7.8 GIVEN: correlation coefficient: - 0.7064 Slope: -0.4667 Coefficient of determination: 49.90% regression equation: ŷ= 11.2360 + (-4467)x FIND: Estimate the winning bid if there were seven bidders. Winning bid cost _________ millions. Explain. Compute the 95% prediction interval for a winning bid if there are seven bidders. [ _______________ , _______________ ] (Explain).arrow_forwardThe National Highway Association is studying the relationship between the number of bidders on a highway project and the winning (lowest) bid for the project. Of particular interest is whether the number of bidders increases or decreases the amount of the winning bid. Bidders Price 9.0 5.1 9.0 8.0 3.0 9.7 10.0 7.8 5.0 7.7 10.0 5.5 7.0 8.3 11.0 5.5 6.0 10.3 6.0 8.0 4.0 8.8 7.0 9.4 7.0 8.6 7.0 8.1 6.0 7.8 Given: Correlation of Coefficient: 0.7064 (This is correct) Coefficient of determination: 49.90% (This is correct) ŷ = 11.2360 + (-0.4667)x (This is correct) Create a scatter plot of the data Complete a regression analysis of the relationship. Slope = ______ Estimate the winning bid if there were seven bidders. Winning bid cost ______ millions. Compute the 95% prediction interval for a winning bid if there are seven bidders. [ _____________, ______________]arrow_forward
- For many years, businesses have struggled with the rising cost of health care. But recently, the increases have slowed due to less inflation in health care prices and employees paying for a larger portion of health care benefits. A recent survey showed that 58% of employers are likely to require higher employee contributions for health care coverage this year relative to last year. Suppose the survey was based on a sample of 900 companies likely to require higher employee contributions for health care coverage this year relative to last year. At 95% confidence, compute the margin of error for the proportion of companies likely to require higher employee contributions for health care coverage. (Round your answer to four decimal places.) Compute a 95% confidence interval for the proportion of companies likely to require higher employee contributions for health care coverage. (Round your answers to four decimal places.) toarrow_forwardPrivate colleges and universities rely on money contributed by individuals and corporations for their operating expenses. Much of this money is invested in a fund called an endowment, and the college spends only the interest earned by the fund. A recent survey of five private colleges in the United States revealed the following endowments (in millions of dollars): 188.9, 249.3, 124.7, 157.6, and 222.8. What value will be used as the point estimate for the standard deviation of endowment of all private colleges in the United States? Round your answer to nearest hundredth(2d.p.) if necessary.arrow_forwardStock A has an expected annual return of 18% and a volatility of 34%. Stock B has an expected annual return of 12% and a volatility of 28%. The correlation of the returns of the two stocks is equal to 0.4. Find the expected return of the efficient portfolio with a volatility of 29%. solve on paper pleasearrow_forward
- You decide to invest in stock in a particular type of company and set the guideline that you will only buy stock in companies that are ranked in the 80th percentile or above in terms of dividends paid in the previous year. You are looking at a company that ranked 7 out of 450 companies that paid dividends in 2019. a.Will this company qualifies for your portfolio? b.If you had the data on the total dividends paid by each of the 450 companies, which measure of average would be the most meaningful – mean, median, midrange, or mode? Explainarrow_forwardA poll uses responses to several questions to calculate a "Happiness" index that measures overall happiness. An article included the happiness index for the 7 years between 2008 and 2016. Also included in the article were the percentages of people who responded "somewhat agree" or "strongly agree" to the following statements. Statement 1 (happy with life) 1: At this time, I'm generally happy with my life. Statement 2 (won't benefit): I won't get much benefit from the things that I do anytime soon. Year 2008 2009 2010 2011 2013 2015 2016 Happiness Index 32 36 34 34 32 35 30 Happy with Life Statement (percentage somewhat or strongly agree) 78 83 78 81 79 82 82 Won't Benefit Statement (percentage somewhat or strongly agree) 35 37 35 37 43 35 42 (a) Calculate the value of the correlation coefficient for Happiness index and the response to the Happy with life statement. (Round your answer to four decimal places.) (b) Calculate the value of the correlation coefficient for Happiness index and…arrow_forward
 Holt Mcdougal Larson Pre-algebra: Student Edition...AlgebraISBN:9780547587776Author:HOLT MCDOUGALPublisher:HOLT MCDOUGAL
 Glencoe Algebra 1, Student Edition, 9780079039897...AlgebraISBN:9780079039897Author:CarterPublisher:McGraw Hill