
Concept explainers
Videos
The Islander Fishing Company purchases clams for
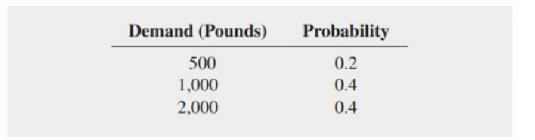
a. For each possible purchase level (500, 1,000, or 2,000 pounds). compute the profit (or loss) for each level of demand.
b. Determine the optimal action based on the maximax criterion.
c. Determine the optimal action based on the maximax criterion.
d. Using the expected monetary value (EMV) criterion, determine the optimal number of pounds of clams the company should purchase from the fishermen. Discuss.
e. Compute the standard deviation for each possible purchase level.
f. Compute the expected opportunity loss (EOL) for purchasing 500, 1,000, and 2,000 pounds of clams.
g. Explain the meaning of the
h. Compute the coefficient of variation for purchasing 500, 1,000, and 2,000 pounds of clams. Discuss.
i. Compute the return-to-risk ratio (RTRR) for purchasing 500, 1,000, and 2,000 pounds of clams. Discuss.
j. Based on (d) and (1). would you choose to purchase 500, 1,000, or 2,000 pounds of claims? Why?
k. Compare the results of (d), (f), (h), and (i) and explain any differences.
l. Suppose that clams can be sold to restaurants for
m. What would he the effect on the results in (a) through (k) if the probability of the demand for 500, 1,000, and 2,000 clams were 0.4, 0.4, and 0.2, respectively?
Want to see the full answer?
Check out a sample textbook solution
Chapter 20 Solutions
Basic Business Statistics Student Value Edition Plus NEW MyLab Statistics with Pearson eText -- Access Card Package (13th Edition)


- A local gas station has developed a new lottery scratch card in which they want 20% of contestants to win a small prize, 5% of contestants to win a medium prize, and 1% of contestants to win a large prize. If the scratch card costs buyers $5, determine how much each prize should award if the store wishes to make a long-run average of $1 for each scratch card sold.arrow_forwardthe lottery winner who is going to invest in utility bonds and a savings account using the following data: Assume that her total winnings are $ 400000, that the utility bonds will pay 3 percent per year, and that the savings account will pay 2 percent per year. How much should she allocate to each investment in order for the yearly incomes from them to be the same?Utility Bonds: $ Savings Account: $ What will be her total yearly income from these investments? $arrow_forwardSuppose a charitable organization decides to raise money by raffling a trip worth $500. If 3,000 tickets are sold at $1.00 each, find the expected net winnings for a person who buys 1 ticket.arrow_forward
- An investor accumulated 1800 shares of Microtel Corporation over a period of several months. She bought 1000 shares at $15.63, 500 shares at $19.00, and 300 shares at $21.75. What was her average cost per share? (Note: Investors who purchase shares in the same company or the same mutual fund at more than one price must eventually do this calculation. Tax rules require that the capital gain or loss on the sale of any of the shares be calculated using the weighted-average price paid for all of the shares, rather than the particular price paid for the shares actually sold.) (Round your answer to the nearest cent.) The weighted average cost per share =arrow_forwardAn investor accumulated 1800 shares of Microtel Corporation over a period of several months. She bought 1000 shares at $15.63, 500 shares at $19.00, and 300 shares at $21.75.What was her average cost per share? (Note: Investors who purchase shares in the same company or the same mutual fund at more than one price must eventually do this calculation. Tax rules require that the capital gain or loss on the sale of any of the shares be calculated using the weighted-average price paid for all of the shares, rather than the particular price paid for the shares actually sold.) (Round your answer to the nearest cent.) The weighted average cost per share = The answer is not 562arrow_forwardThe values listed below are waiting times (in minutes) of customers at two different banks. At Bank A, customers enter a single waiting line that feeds three teller windows. At Bank B, customers may enter any one of three different lines that have formed at three teller windows. Answer the following questions. Bank A6.46.66.76.87.17.37.67.97.97.9Bank B4.15.35.96.26.77.77.78.49.410.0 Click the icon to view the table of Chi-Square critical values. Construct a 90% confidence interval for the population standard deviation sigma at Bank A. (answer) min less than sigma Bank A less than (answer) min Construct a 90% confidence interval for the population standard deviation sigma at Bank B. (answer) min less than sigma Bank B less than (answer) minarrow_forward
- Folgers purchased $147 million of mutual fund shares. The fund had total returns over a 3-year period: 4.11%, 3.56%, and 4.26%. The value at the end of the 3-year period is closest to A. $177.54 million. B. $170.06 million. C. $165.24 million. D. $153.26 million.arrow_forwardThe values listed below are waiting times (in minutes) of customers at two different banks. At Bank A, customers enter a single waiting line that feeds three teller windows. At Bank B, customers may enter any one of three different lines that have formed at three teller windows. Answer the following questions. Bank A6.46.66.76.87.17.37.67.87.87.8Bank B4.35.55.86.16.77.77.78.59.210.0 Click the icon to view the table of Chi-Square critical values. Construct a 90% confidence interval for the population standard deviation sigma at Bank A. (answer) min less than sigma bank A less than (answer) minarrow_forwardThe values listed below are waiting times (in minutes) of customers at two different banks. At Bank A, customers enter a single waiting line that feeds three teller windows. At Bank B, customers may enter any one of three different lines that have formed at three teller windows. Answer the following questions. Bank A6.46.66.76.87.17.37.57.87.87.8Bank B4.15.45.76.16.87.77.78.59.410.0 Click the icon to view the table of Chi-Square critical values. Construct a 99% confidence interval for the population standard deviation sigma at Bank A. Construct a 99% confidence interval for the population standard deviation sigma at Bank B.arrow_forward
- The tree diagram in the shown Figure describes the uncertain cash flows for an engineering project. The analysis period is two years, and MARR = 15% per year. Based on this information, Solve, a. What are the E(PW), V(PW), and SD(PW) of the project? b. What is the probability that PW ≥ 0?arrow_forwardA stock has monthly returns of 4%, 5%, 2%, and -3%. Its geometric average return is closest to: O 195 O 2.43 O 3.36 O 4.17arrow_forwardFor a recent year, the federal income tax owed by a taxpayer (single-no dependents) was based on the individual's taxable income. (Source: Internal Revenue Service, www.irs.gov) If your taxable income is but not over– The tax is of the amount over- over– $0 $8925 $0 + 10% $O $8925 $36,250 $892.50 + 15% $8925 $36,250 $87,850 $4991.25 + 25% $36,250 Write a piecewise-defined function that expresses an individual's federal income tax f(x) (in S) as a function of the individual's taxable income x (in S).arrow_forward
 Intermediate AlgebraAlgebraISBN:9781285195728Author:Jerome E. Kaufmann, Karen L. SchwittersPublisher:Cengage Learning
 Algebra for College StudentsAlgebraISBN:9781285195780Author:Jerome E. Kaufmann, Karen L. SchwittersPublisher:Cengage Learning